

UnitedHealth Stock Stalls Near $377 as Lawsuit Risk Returns

UnitedHealth stock is at a critical juncture after a sharp decline that pushed UNH well below its long-term averages. While a solid recovery has taken place, daily momentum appears to be losing strength, and regulatory risks are returning. The current narrative into June is one of cautious recovery: structurally positive but tactically fragile.
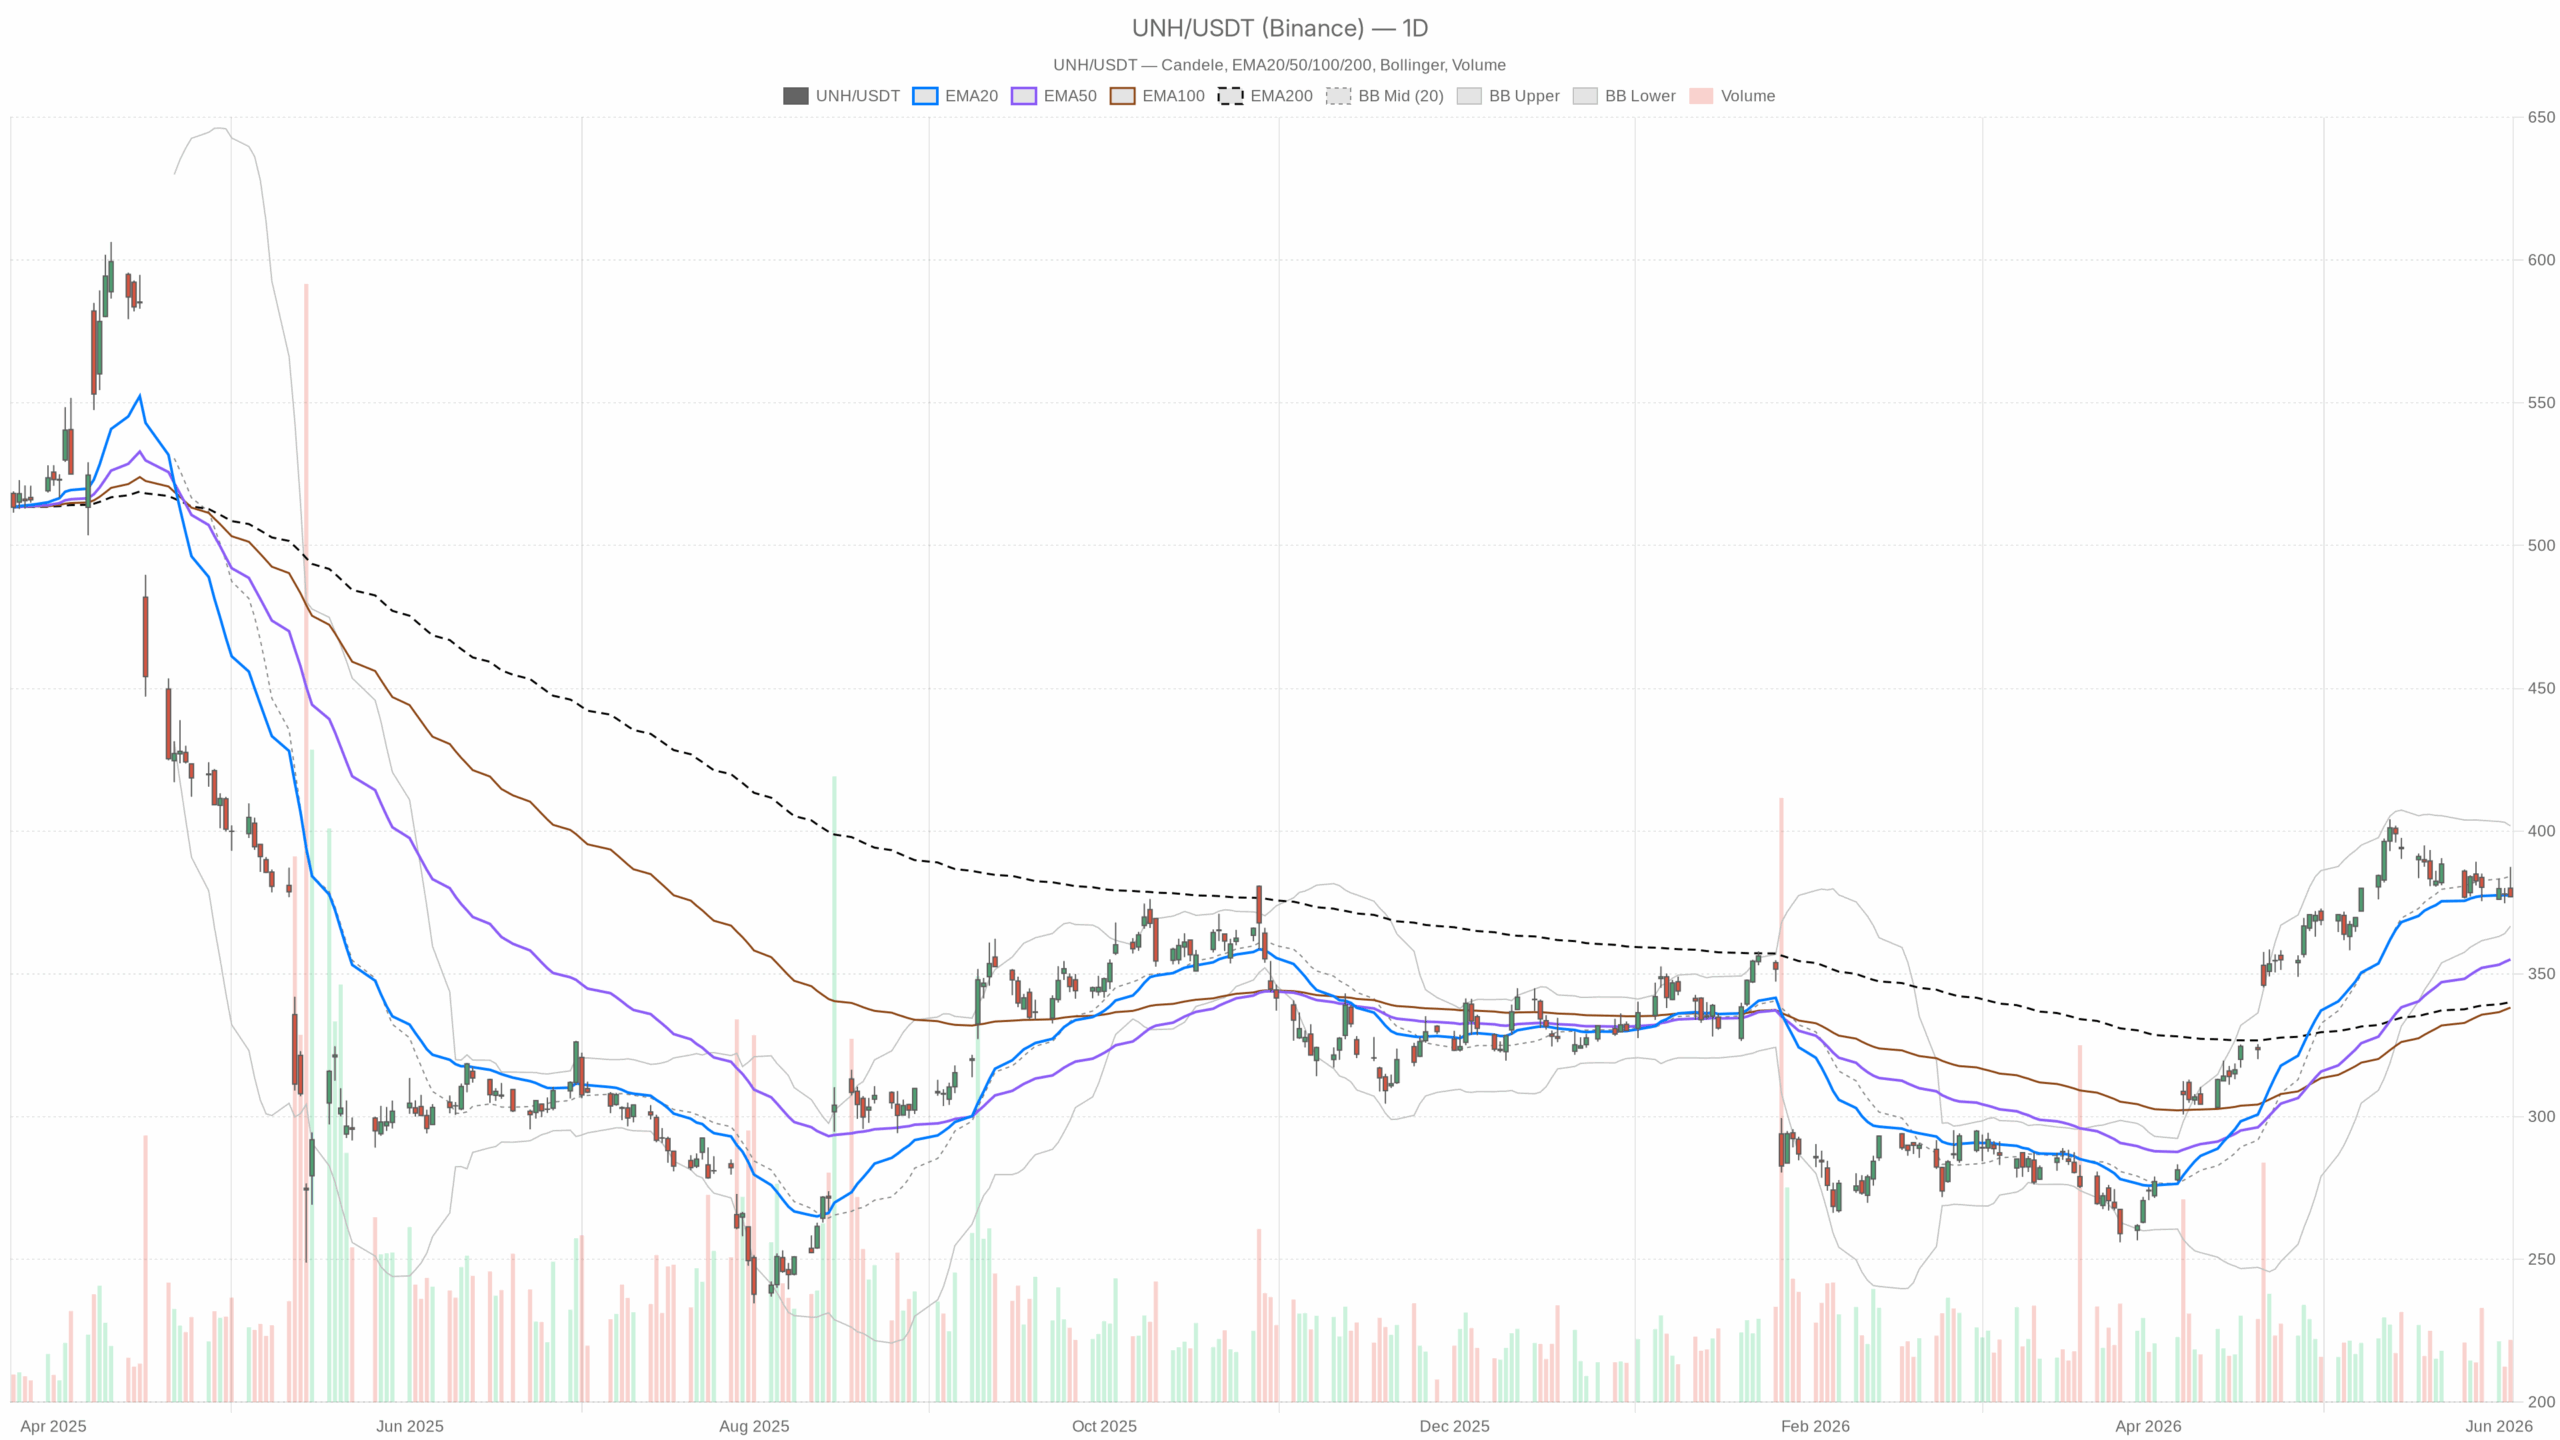 UNH — daily chart with candlesticks, EMA20/EMA50 and volume.
UnitedHealth Stock Technical Outlook on the Daily Chart
On the daily timeframe, UNH closed at $377, nearly flat against its 20-day EMA of $377.51. This proximity highlights that although the stock has reclaimed its 50-day EMA ($355.06) and 200-day EMA ($340.08)—clear positive signs—the upward momentum is currently weakening. The daily trend is neutral: the longer-term trend shows improvement, but short-term direction remains uncertain.
The daily RSI at 54.59 keeps the stock mildly bullish without suggesting overextension. This allows some upside potential but denies a basis for an oversold bounce. The MACD presents a more cautionary signal, with its line at 7.91 below the signal line at 11.98, creating a negative histogram of -4.07. This divergence signals a deceleration in upside momentum despite a positive overall trend.
Bollinger Bands reinforce the cautious stance. The midband at $384.25 is above the current price, marking a resistance level. The upper band at $401.81 sets an ambitious target for bulls, while the lower band at $366.69 acts as critical support. Trading below the midband and closer to the lower band suggests mild bearish pressure within an otherwise intact technical structure.
Volatility remains significant, with a daily ATR of $8.68, highlighting meaningful daily price movements that impact risk management. The daily pivot sits at $380.43, with resistance at $384.03 and support at $373.39. Closing at $377 places the stock between pivot and support, indicating a cautious stance heading into the next session.
Intraday Momentum: The One-Hour and 15-Minute Charts of UnitedHealth Stock
1-Hour Chart: Short-Term Bearish Signals Emerging
The one-hour chart adds complexity to the daily outlook. UNH closed at $377, below the 20-hour EMA ($380.23) and 50-hour EMA ($381.16). This positioning below short-term averages signals intraday selling pressure. Nevertheless, the 200-hour EMA at $370.66 remains below the price, implying the medium-term intraday trend retains some support, although recent momentum is drifting downward.
The 1H RSI at 43.24 shows increasing bearish pressure, nearing the lower neutral zone but not oversold yet. Meanwhile, the 1H MACD histogram has flipped slightly positive at 0.21, hinting at potential stabilization in hourly selling. However, this weak positive signal currently lacks conviction and requires follow-through to influence trading decisions meaningfully.
15-Minute Chart: Near-Term Technical Pressure
The 15-minute timeframe offers useful execution insights. The RSI closed near oversold at 31.77, and the MACD histogram is firmly negative at -0.84. Price closed at $377, below all three key EMAs on the 15-minute chart: 20 EMA at $381.43, 50 EMA at $380.82, and 200 EMA at $381.48. These EMAs form a tight resistance band in the $381–$381.50 zone, which may cap near-term rallies. Despite the RSI’s approach to oversold, technical pressure remains significant, though a brief rebound cannot be ruled out.
UnitedHealth Stock Fundamental and Regulatory Context
On the fundamental front, UnitedHealth recently declared a $2.32 quarterly dividend and re-elected its board, signaling operational stability and shareholder confidence. The Q1 operating cash flow of $8.9 billion reflects solid earnings capacity. These factors underpin some bullish perspectives describing the stock as a potential generational buy.
However, notable headwinds persist. Medicare reimbursement concerns have once again surfaced among institutional discussions. Crucially, a lawsuit in Massachusetts alleges UnitedHealth inflated Medicaid payments by misrepresenting illness severity scores. The company denies these claims, but this legal risk adds uncertainty to valuation models. Combined with ongoing Medicare pressures, these challenges constrain the stock’s ability to sustain a clean technical breakout despite robust cash flows.
Key UnitedHealth Stock Scenarios: Bullish vs. Bearish Outcomes
Bullish Scenario: Reclaiming Critical Levels
The optimistic case hinges on UNH surpassing and holding above the daily pivot at $380.43. A subsequent break above the Bollinger midband at $384.25 would open a path toward the $387–$390 target zone. This scenario aligns with a narrowing and eventual positive shift in the daily MACD histogram, necessary for regaining strong upward momentum. The presence of price above the 50-day and 200-day EMAs, coupled with dividend stability and cash flow strength, supports this constructive outlook.
Positive developments in the legal front or sustained strong cash flow could accelerate gains.
Bearish Scenario: Escalating Legal and Regulatory Risks
The downside scenario sees worsening regulatory and legal pressures driving the stock below the daily support pivot at $373.39. A breakdown to the lower Bollinger band at $366.69 would confirm a reversal from the current recovery. The daily MACD’s continued deterioration and the one-hour price trading below its short-term EMAs reinforce this risk.
If the Massachusetts lawsuit gains momentum or Medicare reimbursement cuts become concrete, UNH could retest the $355–$360 range where the 50-day EMA once offered support.
Conclusion: Navigating UnitedHealth Stock’s Range-Bound and News-Sensitive Nature
Overall, UnitedHealth stock presents a complex picture. The medium-term structural rebound from recent lows remains solid, evidenced by trading well above the 200-day EMA. Yet, short-term momentum is defensive, and legal uncertainties persist. The daily MACD signals a slowing trend rather than acceleration, while elevated ATR emphasizes real risk during trades.
For traders, the $380–$384 area serves as the critical test zone for bullish conviction, while $373 acts as a key support threshold. Until one of these levels is breached decisively, UNH remains a range-bound and news-sensitive stock. Patience is advisable over aggressive positioning in this environment.


Ayrıca Şunları da Beğenebilirsiniz

BHM Capital Becomes First UAE Financial Institution to Connect Clients to Amman Stock Exchange Through ADX’s Tabadul Platform

Sui Crypto Dropped -19.14% in Last Month and is Predicted to Drop to $ 0.592322 By Jun 09, 2026

3 generations of one family were abused in same church community


Popüler Haberler
Daha fazla
