

Ethereum price near $1,780: Will oversold ETH bounce or break lower?
Ethereum traded near $1,777.96 on June 4 after falling 5.07% in 24 hours, according to crypto.news price data.
- Ethereum price fell below $1,800 as sellers tested the $1,825 channel floor and key support zone.
- RSI and Supertrend remain bearish, but exchange supply and staking data show tighter available supply.
- Analysts now watch $1,700, $1,500, $2,022 and $2,360 as the next major price levels today.
The token also lost 10.21% over seven days as the wider crypto market stayed under pressure.
The latest move pushed ETH below the $1,825 area watched by analyst Ali Martinez. It also placed the asset near its weakest zone since April 2025, when ETH fell toward $1,400 before staging a recovery.
Ethereum price loses the $1,825 channel floor
Ali Martinez said Ethereum had reached his $1,825 target after pulling back to the bottom of its channel. He called the area a critical floor that could decide the next major move.
“If $1,825 holds, expect a solid bounce back up toward $2,070 or even $2,360,” Ali Charts wrote. He also said a close below $1,825 would weaken support and likely send ETH toward $1,500.
The live crypto.news feed showed ETH below that level, with a 24-hour range between $1,734.05 and $1,886.55. That range shows buyers tried to defend the lower area, but sellers kept pressure on the daily chart.
Ethereum’s market cap stood near $215.14 billion, while 24-hour trading volume reached $25.76 billion. The token remains down 64.05% from its Aug. 24, 2025 all-time high of $4,946.05.
Technical indicators still favor sellers
The Supertrend remains bearish, with the active red line near $2,022.09. Since ETH trades below that level, the indicator shows that sellers still control the current trend.
For the chart to improve, ETH would need to reclaim the $2,000 to $2,022 area and hold it on the daily chart. Without that move, any short bounce may remain part of a weak trend.
The RSI sits at 18.61, which places Ethereum deep in oversold territory. That reading shows strong downside momentum, but an oversold level does not confirm a rebound by itself.
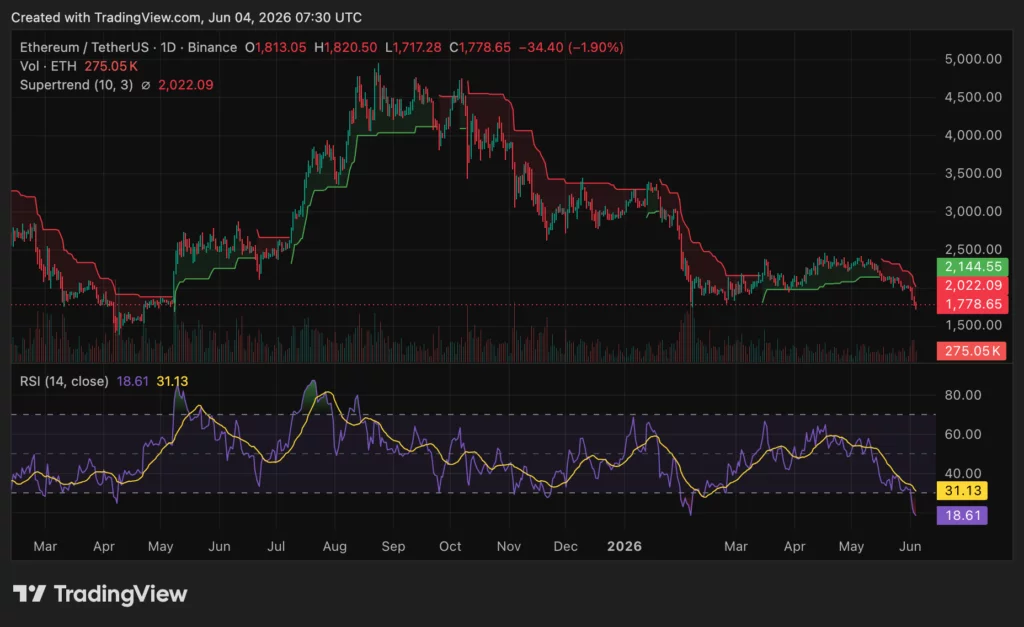
The RSI moving average stands near 31.13, above the current RSI. That gap shows that momentum weakened quickly and that buyers have not yet regained control.
The MACD also remains bearish. The MACD line sits near -2,917.77, below the signal line near -1,584.86, while the histogram is negative near -1,332.92.
A stronger recovery signal would need the MACD line to flatten and move closer to the signal line. Until then, momentum remains weak even with ETH deeply oversold.
On-chain data gives a mixed signal
Leon Waidmann said Ethereum’s price action looks weak, but on-chain data gives a different message. He pointed to ETH on exchanges falling near 15.1 million, a multi-year low.
He also said Ethereum’s staking rate reached a fresh all-time high at 32.42%. More ETH in staking can reduce liquid supply because holders lock tokens to secure the network and earn rewards.
Ali Martinez also reported that Ethereum processed $9.92 billion in transaction volume on June 2. He said that marked the largest one-day network activity spike in two months.
This creates a split picture for traders. Price action shows weakness, while exchange balances, staking, and transaction data show users continue to hold, stake, and move ETH on-chain.
As previously reported by crypto.news, Ethereum staking has become a larger part of institutional treasury activity. More than 36 million ETH had been staked earlier this year, with public firms also building ETH yield strategies.
That does not remove short-term selling pressure. It does show that Ethereum’s network activity and holder behavior remain different from the current chart trend.
Treasury losses and price levels stay in focus
The latest selloff also comes as some Ethereum treasury strategies face losses. Lookonchain said Nasdaq-listed FG Nexus bought 50,770 ETH for about $196 million between August and September 2025.
The firm paid an average price near $3,860, then began selling in November. It has now sold 36,025 ETH at an average price of about $2,330, recovering about $83.92 million.
According to on-chain reports, cumulative losses on the FG Nexus Ethereum treasury strategy have topped $85 million. The company had previously described ETH as its main treasury reserve asset.
As previously reported by crypto.news, other Ethereum treasury firms have also faced losses during the weaker quarter. SharpLink reported $506.7 million in unrealized ETH losses and a $191.7 million LsETH impairment charge in Q1.
Ethereum’s first downside area now sits around $1,700 to $1,717. A clean break below that zone would increase attention on $1,500, the level Ali Martinez named after the loss of $1,825 support.
The deeper historical support zone remains near $1,400, where ETH found a low in April 2025. That level may return to focus if the broader market selloff continues and buyers fail to defend $1,500.
On the upside, ETH needs to reclaim $1,825 first. A stronger recovery would require a daily move back above $2,000 and the Supertrend area near $2,022.
A later push toward $2,070 would show buyers are rebuilding control. A move to $2,360 would need stronger volume and a clear shift in momentum from the RSI and MACD.
Disclosure: This article does not represent investment advice. The content and materials featured on this page are for educational purposes only.


Ayrıca Şunları da Beğenebilirsiniz

Cancer Immunotherapy Market Projected to Reach $311.4 Billion by 2031

Duck Creek CEO Hardeep Gulati Brings the Trusted AI Playbook to Insurtech Insights USA

Pi Network V26 Shock Prediction Could Change Pi Coin Forever


Popüler Haberler
Daha fazla
