

Solana (SOL) Breaks Below Key Support as Analysts Eye $53 Target
Key Takeaways
- Solana is currently priced at approximately $69.53, showing a decline exceeding 6% over the last day and falling more than 42% year-to-date.
- The pivotal $77 support zone has been breached, prompting analyst Ali Martinez to identify $53 as the next significant downside level.
- All primary exponential moving averages (20, 50, 100, and 200-day EMAs) now sit above current price action, signaling a confirmed downtrend.
- Decentralized exchange activity on Solana has contracted by 62% since the beginning of the year, declining from $111 billion to $42 billion per month.
- A five-month trading range between $77 and $97 has been violated to the downside, suggesting potential continuation toward the $50 region.
Solana has continued its downward trajectory following a breakdown beneath a significant support area that market participants had been monitoring closely. Currently, SOL is changing hands at $69.53, registering a 24-hour trading volume of $8.31 billion against a market capitalization of $40.22 billion.
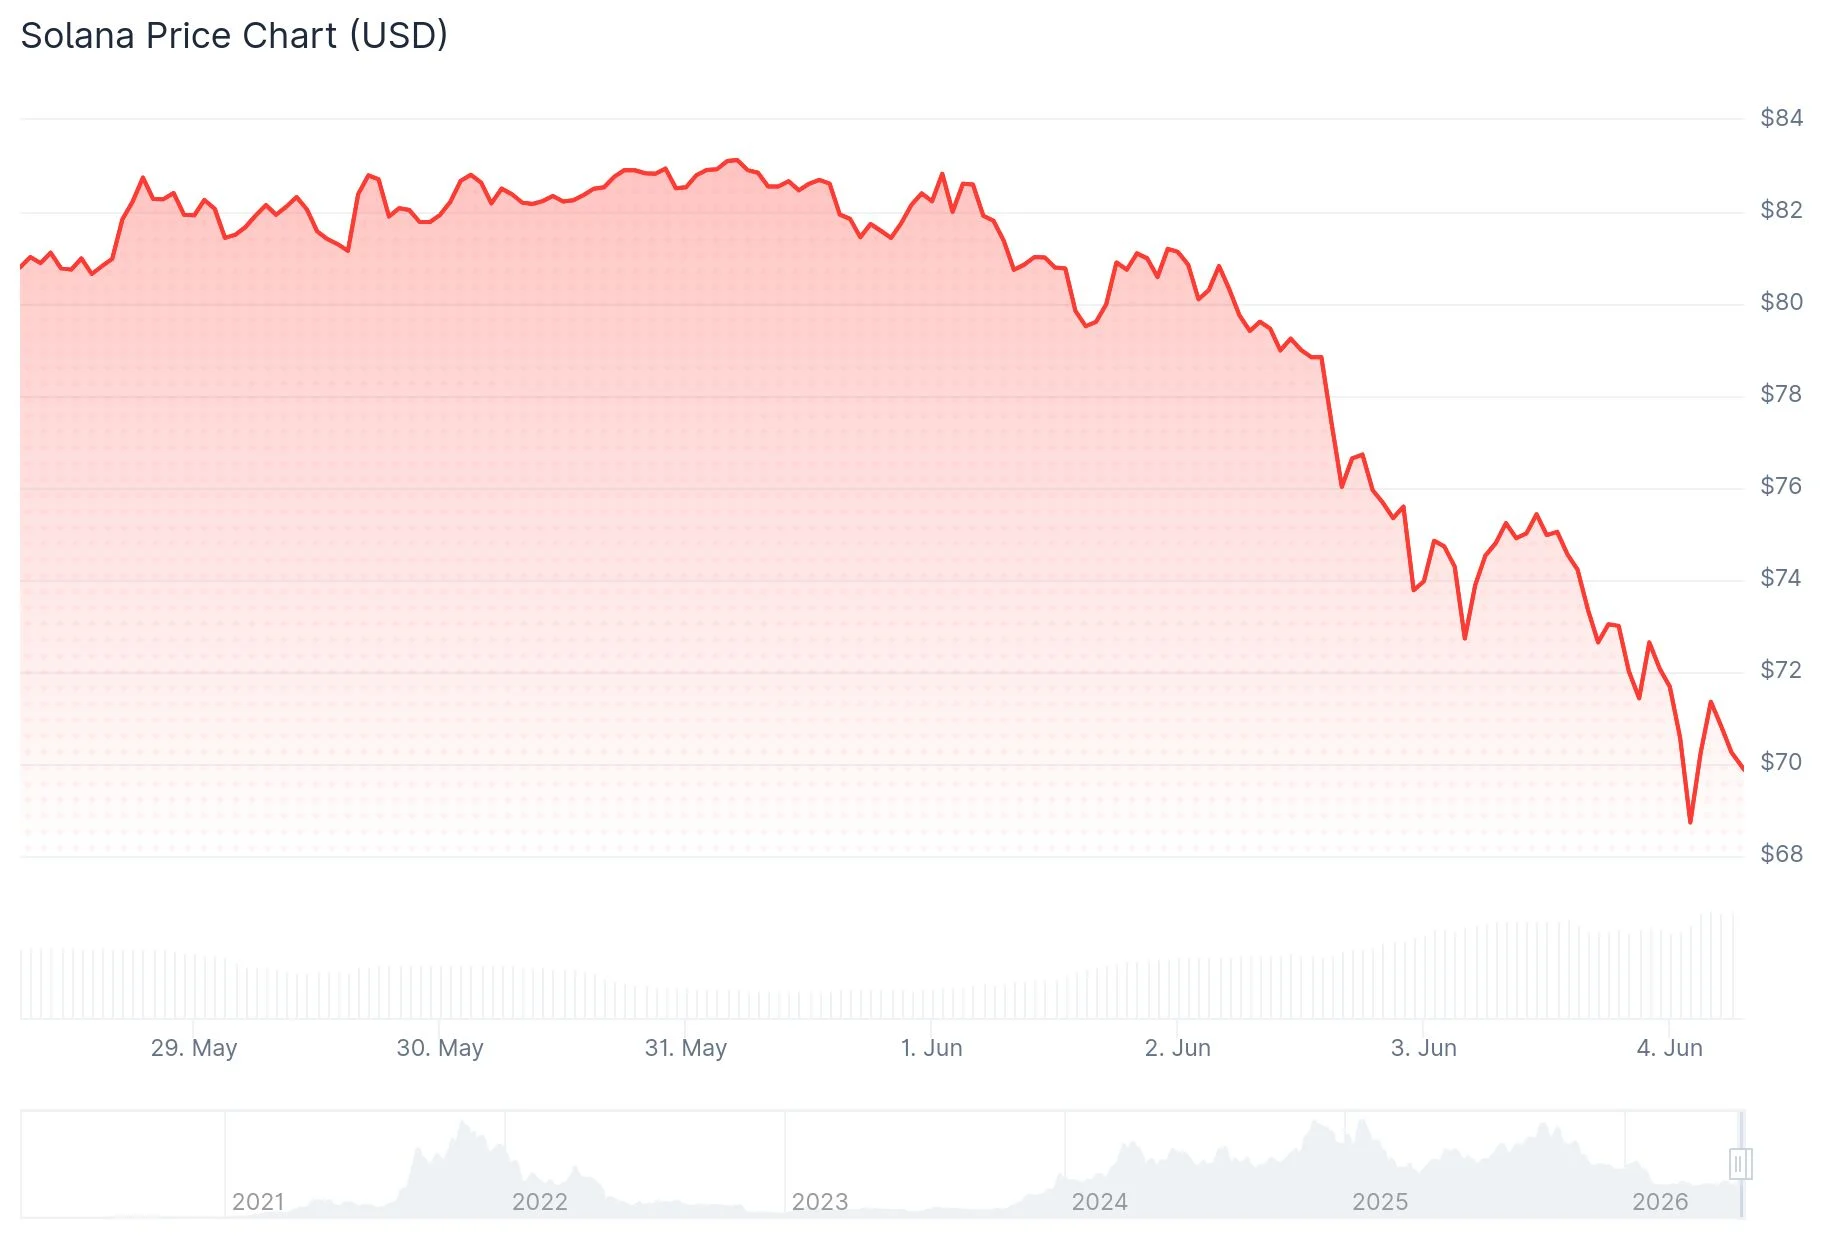 Solana (SOL) Price
The cryptocurrency has declined 6.45% during the previous 24-hour period and has dropped over 42% since January 1st, positioning it among the weakest performers within the large-cap cryptocurrency segment in 2026.
Cryptocurrency analyst Ali Martinez highlighted the $77 price point as a crucial support area, drawing on insights from the UTXO Realized Price Distribution (URPD) framework. This particular level exhibited substantial concentration of historical investor participation, indicating significant buying activity occurred within this price range.
Following the breakdown of this zone, Martinez observed a notable absence of demand beneath the $77 threshold. He pinpointed $53, $35, and $24 as subsequent regions where support might materialize.
When a significant level such as $77 is breached, market volatility typically intensifies as fewer market participants emerge to counteract selling pressure.
Bearish Signals Across All Technical Metrics
SOL currently trades beneath each significant exponential moving average. Data from TradingView indicates the 20-day EMA resides at $81.19, the 50-day at $84.44, the 100-day at $89.84, and the 200-day at $105.62.
This uniform positioning across multiple timeframes validates that the overarching market structure remains decisively bearish. The MACD indicator reinforces this assessment, with the MACD line positioned beneath the signal line while expanding negative histogram bars demonstrate accelerating downward momentum.
Analyst Daan Crypto Trades also weighed in on the wider altcoin landscape, observing that numerous cryptocurrencies display chart patterns resembling SOL. He referenced multi-month consolidation zones that have experienced breakdowns or wicks penetrating below range boundaries. Daan suggested favorable trading setups would begin materializing once price action recaptures those regional ranges, potentially enabling moves toward or beyond the range highs.
The Relative Strength Index (RSI) on weekly timeframes registers at 32, a reading generally interpreted as bearish when falling beneath the 40 threshold.
Network Activity Shows Significant Contraction
Decentralized exchange volumes on the Solana network have contracted by 62% since the start of the year. Monthly DEX volumes reached their zenith at $111 billion but have since retreated to $42 billion in the most recent month.
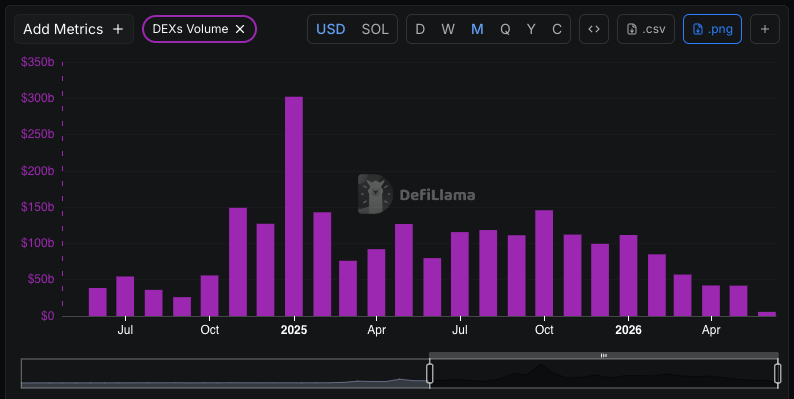 Source: DefiLlama
Overall transaction volumes across the network have similarly stagnated at approximately 700 million weekly after establishing a peak of 959 million during early February.
Market observers have attributed the reduction in meme coin speculation as a primary contributing factor. Solana’s blockchain infrastructure derived substantial recent activity from meme coin trading, and as enthusiasm for this segment diminished, network metrics followed suit.
Solana has penetrated below its five-month consolidation pattern bounded by $77 and $97 on daily charts. Technical analysts indicate that such breakdowns frequently signal continuation of the preceding downward trend.
The immediate technical objective to monitor is $65. Successful defense of that level could provide price stabilization, though failure to hold may create pathways toward the $53 target outlined by Martinez.
The post Solana (SOL) Breaks Below Key Support as Analysts Eye $53 Target appeared first on Blockonomi.


Ayrıca Şunları da Beğenebilirsiniz

Bitcoin & Ethereum Inflows Hit 1-Year Low as Crypto Investors Brace for Fed Decision – BTC Eyes $120K

Why Is Bitcoin Price Crashing: Pepeto Presale Pulls $8 Million From Early Believers While SOL and DOGE Bleed Out

Kaspa Gained 10.02% in Last Month and is Predicted to Drop to $0.028204 By Apr 06, 2026


Popüler Haberler
Daha fazla
