

Bitcoin Price 10% Selloff Sparks Fears Of A Deeper Breakdown
Bitcoin price started a fresh decline below the $68,000 zone. BTC is down over 10% and might continue to move down if it dips below $62,000.
- Bitcoin failed to stay above $68,500 and extended losses.
- The price is trading below $65,000 and the 100 hourly simple moving average.
- There is a bearish trend line forming with resistance near $65,200 on the hourly chart of the BTC/USD pair (data feed from Kraken).
- The pair might extend losses if it stays below the $65,000 and $66,500 levels.
Bitcoin Price Takes A Major Hit
Bitcoin price failed to stay above the $70,000 support zone. BTC remained in a bearish zone and extended losses below the $68,000 level. There was a move below the $65,000 level.
The price even dipped below $63,200. A low was formed at $62,490 and the price is now showing many bearish signs. It is well below the 23.6% Fib retracement level of the downward move from the $74,070 swing high to the $62,490 low.
Bitcoin is now trading below $65,000 and the 100 hourly simple moving average. If the price remains stable above $62,000, it could attempt a fresh increase. Immediate resistance is near the $63,500 level.
The first key resistance is near the $64,000 level. A close above the $64,000 resistance might send the price further higher. In the stated case, the price could rise and test the $65,000 resistance. There is also a bearish trend line forming with resistance near $65,200 on the hourly chart of the BTC/USD pair.
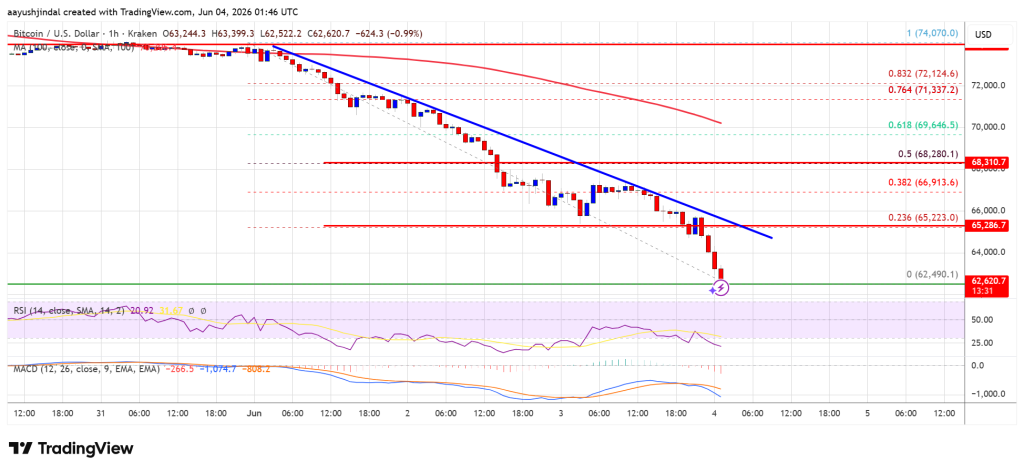
Any more gains might send the price toward the $66,500 level. The next barrier for the bulls could be $68,000 or the 50% Fib retracement level of the downward move from the $74,070 swing high to the $62,490 low.
More Losses In BTC?
If Bitcoin fails to rise above the $65,000 resistance zone, it could start another decline. Immediate support is near the $62,500 level.
The first major support is near the $62,000 level. The next support is now near the $61,200 zone. Any more losses might send the price toward the $60,500 support in the near term. The main support now sits at $60,000, below which BTC might struggle to recover in the near term.
Technical indicators:
Hourly MACD – The MACD is now gaining pace in the bearish zone.
Hourly RSI (Relative Strength Index) – The RSI for BTC/USD is now below the 50 level.
Major Support Levels – $62,000, followed by $60,000.
Major Resistance Levels – $64,000 and $65,000.


Ayrıca Şunları da Beğenebilirsiniz

Bitcoin’s Rising Realized Losses Among Short-Term Investor Coincide With Growing Crypto Exchange Inflows

Smart Money Keeps Buying HYPE Despite Rising Market Fear – Price Holds Above $70 Level

Safe Havens Are Failing — Why Gold, Silver, and Crypto Are All Falling Together


Popüler Haberler
Daha fazla
