

Solana price today trapped at $78 as Fear & Greed drops to 22

As of July 9, 2026, the Solana price today sits at $78.23 with markets gripped by Extreme Fear. The total crypto cap at $2.24 trillion, according to CoinGecko, has barely moved in 24 hours. This bounce reflects the absence of new sellers, not genuine conviction — a fragile setup.
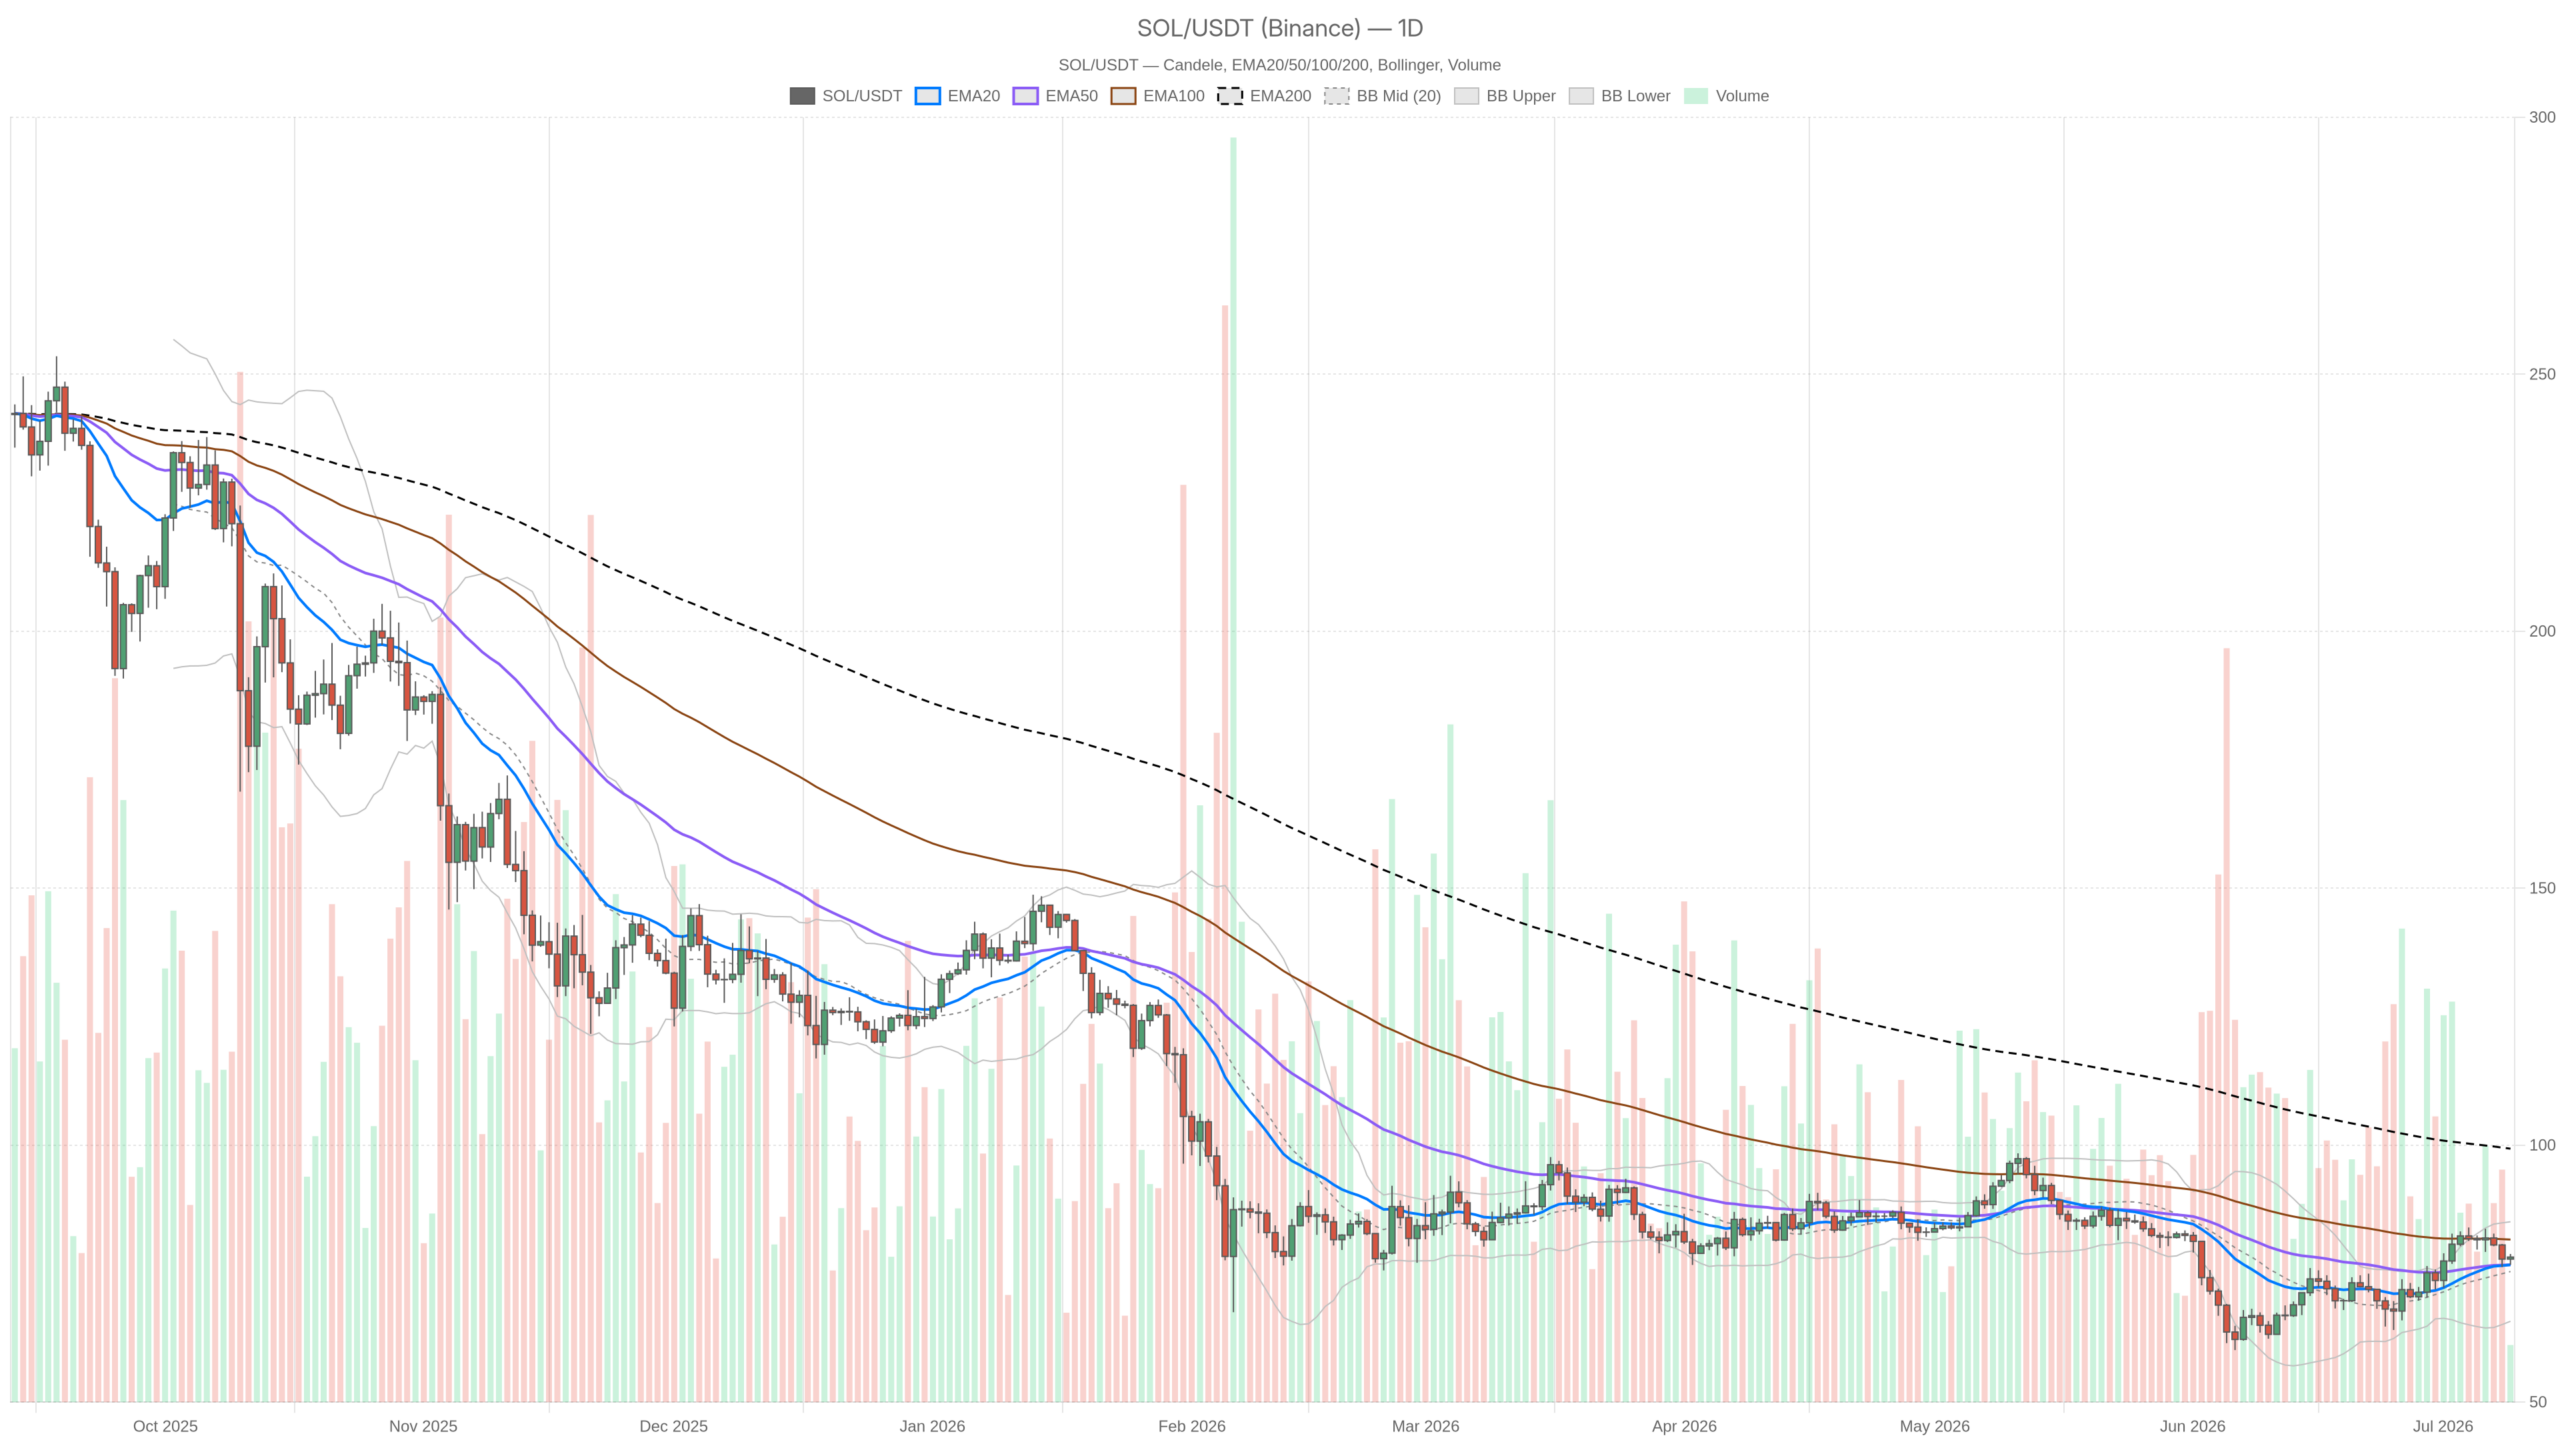 SOL/USDT — daily chart with candlesticks, EMA20/EMA50 and volume.
Key takeaways
- Solana trades at $78.23, up from recent lows but still 21% below its 200-day moving average of $99.31.
- The Fear & Greed Index has collapsed to 22, signaling Extreme Fear across the crypto market.
- Bitcoin dominance holds at 56.08%, confirming capital remains huddled in the flagship asset rather than flowing into altcoins.
- The daily MACD shows a trending-up configuration at 1.93 above signal, while the RSI sits at a neutral 54.74.
- On-chain activity is fragmented: PumpSwap fees surged 150.73% over 30 days, but Raydium fees dropped 45.17% in the same period.
Daily Chart: Cautiously Constructive but Incomplete
The daily chart presents a cautiously constructive picture where short-term momentum has improved, but the long-term structure remains bearish. Solana is trading roughly 21% below its 200-day moving average at $99.31. Any analysis that ignores this overhead ceiling is not being fully honest about the macro trend.
Price at $78.23 has managed to push above both the EMA20 at $76.72 and EMA50 at $76.73, which have converged almost exactly at the same level. That kind of EMA convergence typically acts as a springboard when price is above it, signaling that short-term and medium-term trends are aligned upward. The MACD reinforces this: the line sits at 1.93, above the signal at 1.39, with a positive histogram of 0.54. However, the RSI at 54.74 tells a more measured story. It sits above the midpoint, meaning sellers are not dominating, but there is no real urgency in buying pressure either.
The Bollinger Bands provide useful range context. With the midline at $75.41, upper band at $85.10, and lower band at $65.73, price currently occupies the upper half of the range. That is directionally supportive, but it also means there is limited room before Solana runs into the upper band at $85.10. This is a natural resistance zone where momentum trades often stall. Moreover, the daily ATR of 4.15 confirms this asset routinely moves $4 in a session, so precision matters less than positioning direction. The daily pivot structure places the pivot point at $77.92, with R1 resistance at $79.14 and S1 support at $77.02. This leaves price in a genuinely tight spot that tends to resolve decisively.
1-Hour Frame: Compression Without Clear Direction
The 1-hour timeframe reveals a compressed, directionless structure. Price sits above the EMA20 at $77.88 but below both the EMA50 at $78.73 and EMA200 at $78.95, creating a tight squeeze that will likely resolve within hours to a day or two. The MACD line at -0.18 remains below zero, though the histogram has turned positive at 0.25. This means negative momentum is losing steam but has not yet reversed.
The 1-hour Bollinger Bands confirm the compression story: upper band at $78.42, with price pressing right against it. That is compression, not a breakout. The RSI at 52.4 on this timeframe is essentially neutral, refusing to give a signal either way. Meanwhile, the hourly pivot sits at $78.42, R1 at $78.65, and S1 at $78.02. The range between S1 and R1 is barely $0.63 — coiled tight, and coiled markets eventually spring.
15-Minute View: A Micro-Bid Takes Shape
The 15-minute chart shows a modest bullish alignment. Price at $78.25 sits above both the EMA20 at $78.01 and EMA50 at $77.76, while the MACD is in positive territory with a histogram tick of 0.05. The RSI at 57.34 leans upward without being overbought — the kind of micro-structure traders look for when entering a long with tight risk. However, with the EMA200 at $78.72 acting as a near-term ceiling, even the shortest timeframe has overhead resistance to contend with.
On-Chain Activity: Mixed Signals from Solana’s DeFi
Solana’s on-chain data presents a mixed picture that adds important context beyond the price chart. PumpSwap has seen a dramatic 150.73% fee surge over 30 days, suggesting genuine activity spikes in certain pockets of the ecosystem. However, Raydium AMM — arguably the more structurally important DEX — has seen fees drop 45.17% over 30 days and 32.06% over 7 days. Orca DEX tells a similar story, down 37.11% week-over-week.
The overall message is that activity is fragmented and declining in the core venues, even as newer protocols grab attention. A healthy Solana bull market typically needs Raydium trending up, not down. That said, the PumpSwap data shows innovation continues to attract users, which may support longer-term ecosystem growth even if near-term metrics look soft.
Bullish Scenario: What Needs to Happen
For Solana to make a genuine run higher, the sequence must follow a clear path. First, it must clear and hold above $79.14 — the daily R1. Then it needs to reclaim the 1-hour EMA50 and EMA200 on a closing basis around $78.73 to $78.95. Finally, the MACD on the 1-hour must cross back into positive territory with follow-through volume. That combination would put $85.10 — the daily Bollinger upper band — firmly in play as a near-term target.
A push through $85 with sustained momentum opens the path toward $90 and beyond, where the next real structural test waits. The Fear & Greed reading at 22 actually matters here: historically, sustained recoveries from Extreme Fear can be sharp once sentiment shifts, and the daily MACD setup supports that possibility. However, the bullish case requires everything to align — and in a market this fearful, alignment is never guaranteed.
Bearish Scenario: The Easier Path Lower
The path lower is simpler to map and arguably requires fewer conditions to trigger. Specifically, if the 1-hour price cannot reclaim the EMA50/200 cluster around $78.73 to $78.95 and starts printing lower highs, the daily chart’s recovery story falls apart quickly. A failure at the daily R1 of $79.14 — which is literally the next level up — combined with Extreme Fear and BTC dominance entrenching above 56%, would reinforce the thesis that this was just a relief bounce in a broader distribution phase.
In that scenario, a retest of $65.73 — the daily lower Bollinger band — becomes plausible. With ATR at $4.15 per day, that move would not take long to develop. Moreover, the long-term bearish argument is harder to dismiss given the EMA200 at $99.31. Until SOL closes consistently above the mid-$80s and starts compressing that gap, the macro trend remains broken regardless of what shorter timeframes show.
Positioning Strategy in a Coiled Market
What this all amounts to is a market that has made a real short-term recovery but has not yet earned the right to call itself a trend change. The daily regime sits flagged as neutral for good reason — it is genuinely on the fence. Solana is at a pivot level, just below R1, with the hourly structure compressed and the 15-minute frame nudging higher. That setup resolves clearly, usually within hours to a day or two.
The ATR of $4.15 on the daily means anyone holding SOL through this compression should size positions with that volatility in mind. This asset can cover significant ground quickly in either direction. Moreover, the Extreme Fear environment means liquidity can be thin, which amplifies moves. Those watching the Solana price today for a directional signal should keep their eye on the $79.14 level above and $77.02 below. Those are the lines that separate the recovery narrative from the failed-bounce narrative. The technicals are set up for a decisive move; what they do not tell us is the direction.
FAQ
What is Solana’s current price?
As of July 9, 2026, Solana trades at $78.23 on the SOL/USDT pair, up modestly from recent lows but still 21% below its 200-day moving average of $99.31. The broader crypto market remains gripped by Extreme Fear, with the Fear & Greed Index at just 22.
What are the key resistance levels for Solana right now?
The immediate resistance sits at $79.14 (daily R1), followed by the daily Bollinger upper band at $85.10. Beyond that, the major structural resistance is the 200-day moving average at $99.31, which SOL needs to reclaim to confirm a long-term trend reversal.
Is Solana’s current recovery sustainable?
The recovery has technical backing on shorter timeframes, with the daily MACD trending upward and price above the EMA20/EMA50 confluence. However, sustainability depends on clearing the $79.14 level with volume, reclaiming the 1-hour EMAs, and eventually compressing the gap toward the EMA200 at $99.31. Without these conditions, the bounce risks failing.
What is driving Solana’s on-chain activity?
On-chain activity shows a split picture. PumpSwap fees surged 150.73% over 30 days, indicating genuine interest in newer protocols. However, core venues like Raydium saw fees drop 45.17% over the same period, and Orca DEX declined 37.11% week-over-week. A healthy Solana ecosystem typically requires the major DEXs to trend upward, not down.
&
Disclaimer: This article is for informational purposes only and does not constitute financial advice, an investment recommendation, or a solicitation to buy or sell any financial instrument or cryptocurrency. The analysis provided is not indicative of future results. Investing in crypto assets and financial markets carries a high risk of capital loss. Always do your own research (DYOR) and consult a qualified financial advisor before making any decision.
Article produced with the assistance of artificial intelligence and reviewed by the editorial team.


You May Also Like

Unleashing A New Era Of Seller Empowerment

PHL new upper-middle-income status should spur human capital investments – CPD, UNFPA

StakeStone (STO) Rockets 125%: What $981M Trading Volume Reveals



