A $2 trillion market cap loss made H1 2026 crypto’s worst half-year in four years
For the global crypto ecosystem, the first half of 2026 felt like an ambush: a 48% wipeout in total market capitalisation, Ethereum losing more ground than at almost any point since the DAO hack, and a $3.2 billion single-day liquidation cascade that stands as the largest forced sell-off in crypto history.
What almost nobody will tell you is that the market warned everyone this was coming, four years in advance, in the most literal sense possible.
Bitcoin’s supply halves roughly every four years. Every halving since 2012 has produced a blow-off top about a year later, followed by a correction that lands on almost the same point in the calendar. The 2020 halving peaked in November 2021 and bottomed in November 2022. The 2024 halving peaked last October.
,Do the arithmetic, and the 2026 crash isn’t a black swan; it’s Bitcoin keeping an appointment it made four years ago.
Apart from the Bitcoin halving, factors like Trump’s global tariff shock, a Nasdaq correction, over $3.2 billion in single-day forced liquidations, Bitcoin ETFs flipping to net sellers with $3.8 billion in outflows, and the Iranian war exacerbated the situation.
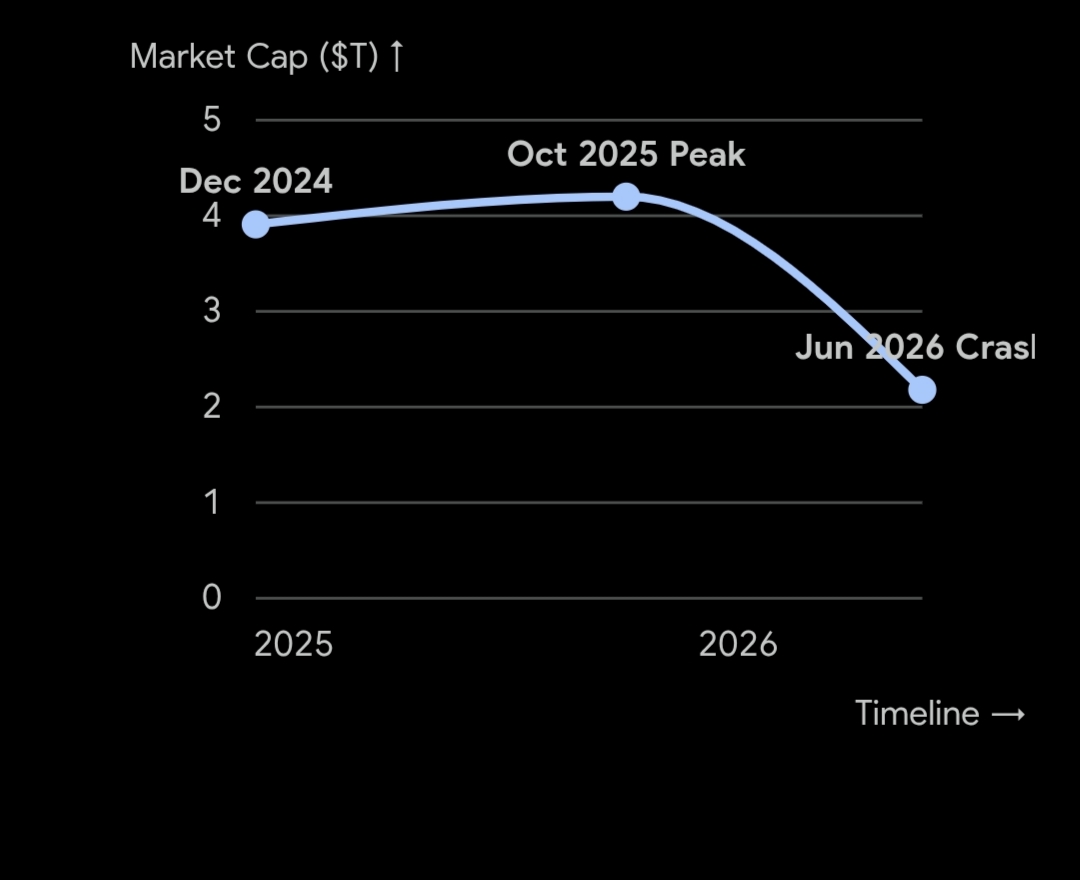 A graphic representation of the crypto market cap movement
That reframing matters, because it turns “how bad was H1 2026?” into a more useful question: how does this half stack up against the three that came before it, and what does the pattern actually predict?
The scoreboard, four opening halves in a row
Line up the first six months of each year since 2023, and a pattern of diminishing euphoria emerges, followed by a violent snap.
- H1 2023 was a reconstruction. Bitcoin roughly doubled off its post-FTX lows as the market clawed back trust from close to zero, the quietest and least glamorous half of the four.
- H1 2024 was a validation. Spot Bitcoin ETFs won SEC approval in January, Bitcoin punched through $73,000 in March for a fresh all-time high, and the half closed at $62,678.29 — part of a run that carried Bitcoin to a 120.98% gain for the full year.
- H1 2025 was the calm before the fall. Bitcoin closed June near $107,135–$107,289, up roughly 15% for the half, on steady institutional inflows rather than retail mania. That composure didn’t survive the back half of the year: 2025 finished down 6.33% overall, after touching an all-time high of $126,198 in October and a low of $74,437 in April.
- H1 2026 was the reckoning. Bitcoin opened the year near $87,520, spiked to $97,008 by January 15, then never returned to that level. February alone erased 21.7% with the token sliding to a year-low of $60,862 in June. Measured from January 1 to early June, the 27.7% loss is Bitcoin’s second-worst first half on record, beaten only by 2022, and every other year in the modern dataset posted a positive first half by comparison.
The irony is that the coin behaving most normally this year is the one everyone panicked about. Bitcoin’s roughly 52% drawdown from its October peak is actually the mild end of the damage.
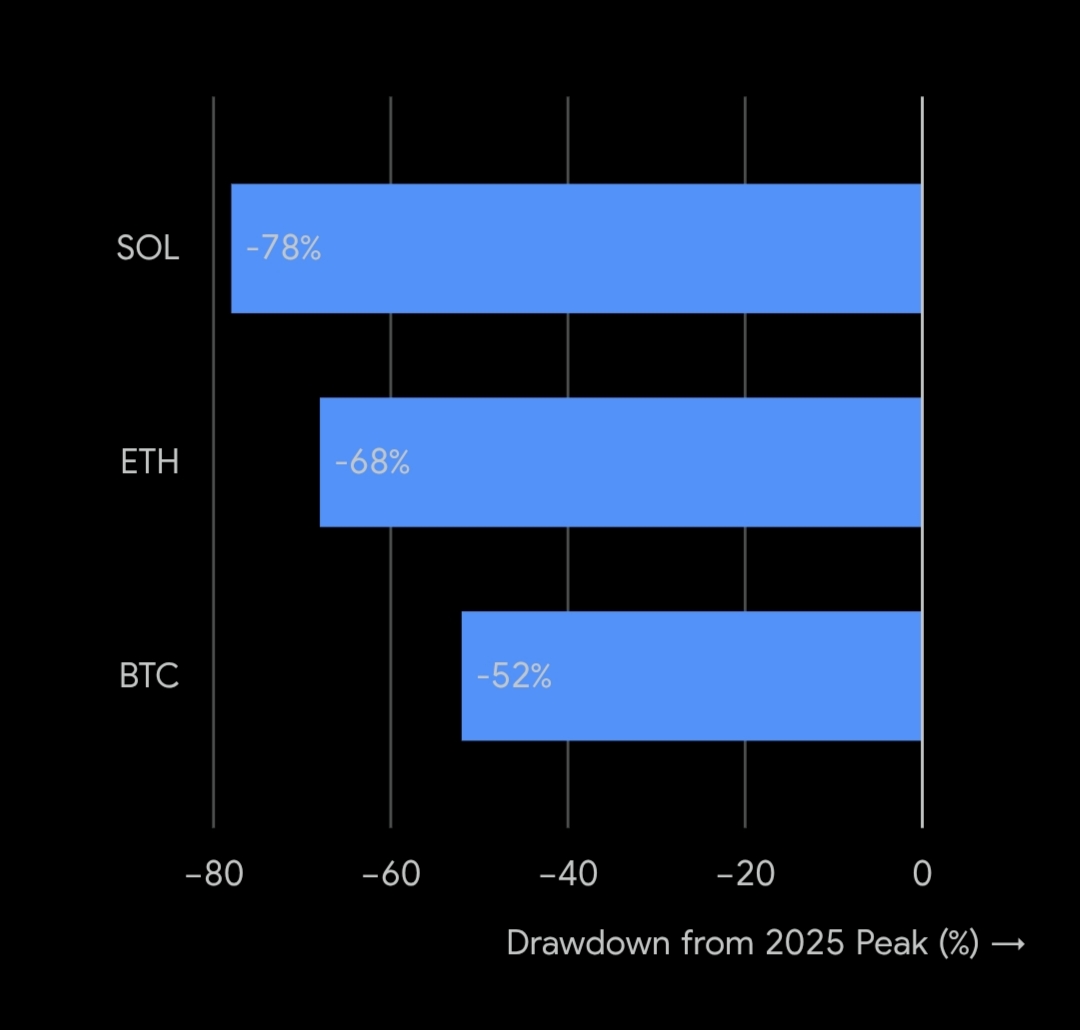 Major tokens dip in H1
Ethereum: the asset that was supposed to be the hedge became the amplifier.
Ethereum has fallen harder than Bitcoin this cycle, down roughly 68% from its August 2025 all-time high near $4,950 versus Bitcoin’s roughly 52% decline from its own peak, dragging the ETH/BTC ratio to multi-year lows.
The path there was almost a controlled demolition: ETH closed 2025 near $2,968 after nine straight red months, then slid from around $3,300 at the start of January 2026 to below $1,826 by February 6 as a broader macro and AI-sector sell-off triggered heavy leveraged liquidations.
By late June, ETH was trading near $1,550, below every major moving average, with a completed death cross and an RSI near 30, the weakest technical picture of any large-cap crypto asset.
For a network that positioned itself as the institutional-grade, yield-bearing alternative to Bitcoin, underperforming the asset it was supposed to complement is the half’s most uncomfortable storyline.
Solana and XRP: the 2025 winners became the 2026 casualties.
Both tokens rode genuinely strong 2025 narratives, Solana’s retail and DeFi trading volume and XRP’s resolved SEC litigation and subsequent ETF approvals, directly into the 2026 wringer. Solana fell to as low as $61 in June 2026, a 78% decline from its 2025 peak above $280, and is down roughly 47.3% year-to-date; XRP has given back about 37.7% year-to-date, trading near $1.18 after surging on regulatory clarity in late 2024 and 2025.
Crypto market cap: $2 trillion gone in eight months
Zoom out and the aggregate numbers tell the same story at a bigger scale. Total crypto market cap nearly doubled in 2024, up 97.7% to peak at $3.91 trillion in mid-December before settling near $3.40 trillion.
That expansion continued into 2025, culminating in an all-time high. The total crypto market cap then fell from a $4.2 trillion October 2025 peak to $2.18 trillion by June 2026, a 48% wipeout that erased nearly $2 trillion in value in eight months.
As of writing, the global market sits near $2.15 trillion with Bitcoin dominance around 56–59%, a reminder that even in a bear phase, capital is consolidating into the asset with the deepest institutional plumbing rather than spreading evenly across the field.
The question worth asking isn’t “Why did this happen?” It’s “When does it stop?”
The previous cycle’s peak-to-trough window ran exactly 365 days, from a November 2021 top to a November 2022 low. If 2026 is tracking that same rhythm from its October 2025 peak, the historical marker points toward a possible floor sometime around late 2026. That’s not a guarantee, but a pattern that has now held twice, and the market has a habit of rhyming even when investors swear this time is different.
What H1 2026 really proved is that crypto’s four-year rhythm hasn’t been broken by ETFs, institutional treasuries, or regulatory clarity, it has just been dressed up differently each cycle. The names of the winners and losers change. The calendar, so far, does not.


You May Also Like

IBAN Explained: The Global Banking Standard Quietly Powering International Payments

Reports: Nagelsmann steps down as Germany coach after Paraguay defeat