Crypto Hacks Q2 2026: $812 Million Lost as Infrastructure Attacks Dominate DeFi Security Failures
The second quarter of 2026 was one of the costliest three-month stretches for crypto users in recent memory. Between April and June, at least 124 separate hacking incidents were recorded across DeFi protocols, exchanges, bridges, and blockchain infrastructure, draining a combined $812.1 million from wallets, treasuries, and liquidity pools.
What makes this quarter especially worth studying is not just the size of the losses, but how unevenly they were distributed. A single month, April, accounted for nearly 80% of the entire quarter’s damage, driven by two mega-hacks that together crossed the half-billion-dollar mark. Meanwhile, May and June told a different story: smaller individual losses, but a steadily rising number of incidents, suggesting attackers broadened their net even as they hunted for smaller, easier targets.
This report walks through the full Q2 2026 picture using verified incident data collected across the three months, covering every hack, every chain, and every attack technique, so that builders, investors, and everyday crypto users can understand exactly where the risks concentrated and what it means for how they manage their funds going forward.
Although this report analyzes Q2 as a whole, each month told a different story. Readers looking for a closer examination of the incidents behind these trends can refer to our detailed June crypto hack reports.
The Big Picture: $812 Million in Three Months
Across April, May, and June combined, the numbers break down like this:
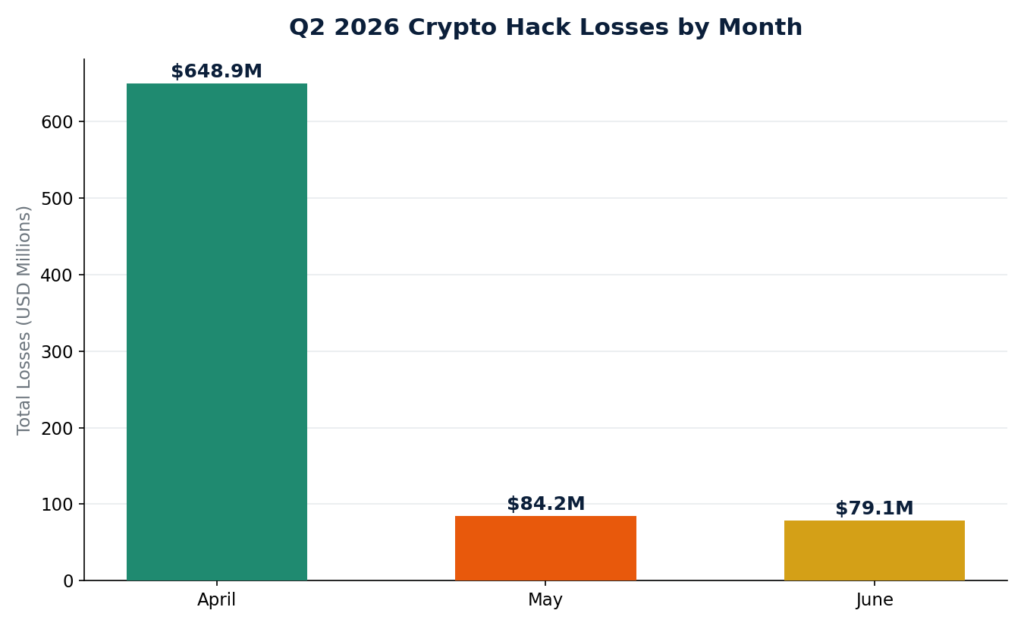
- April 2026: $648.9 million lost across 38 incidents
- May 2026: $84.2 million lost across 41 incidents
- June 2026: $79.1 million lost across 45 incidents
 Q2 2026 Monthly Hack Losses
April alone represents roughly 80% of the entire quarter’s losses, while May and June combined made up just over 20%. This is a pattern that shows up again and again in crypto security data: a small number of catastrophic, high-value hacks can dwarf dozens of smaller ones. In fact, the top three hacks of the quarter alone accounted for 76.3% of all Q2 losses, meaning the overwhelming majority of the financial damage came from just a handful of incidents, not from the sheer volume of attacks.
That said, volume still matters. Incident counts actually climbed steadily through the quarter, rising from 38 in April to 41 in May and 45 in June, even as the dollar amounts dropped sharply. This divergence is worth sitting with: attackers didn’t slow down in May and June, they simply shifted toward smaller, more numerous targets after the big infrastructure-level scores earlier in the quarter.
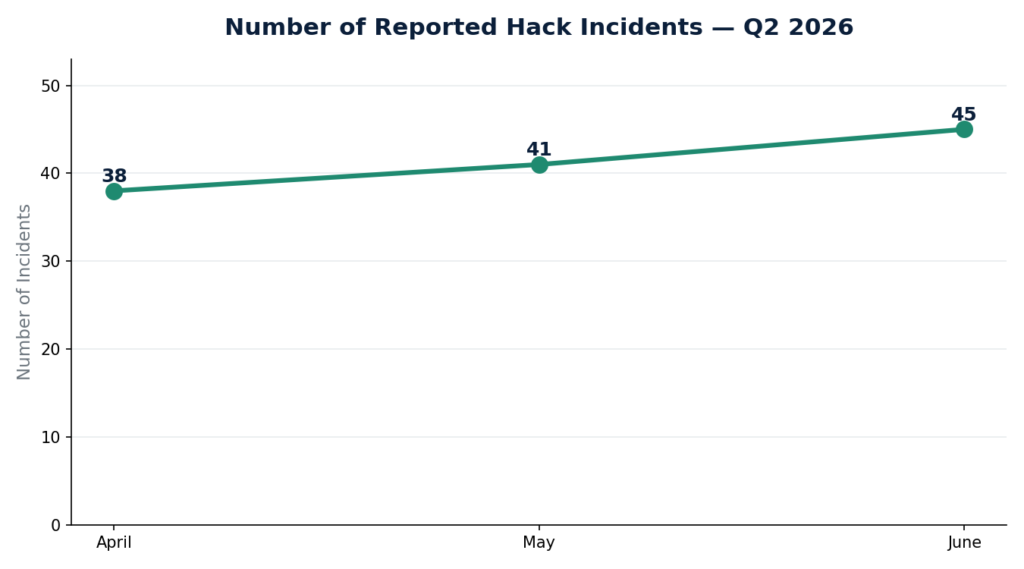 Number of Reported Hack Incidents per Month, Q2 2026
For everyday users, this trend is a reminder that hack frequency doesn’t dip just because headline numbers shrink. Mid-sized and smaller protocols were hit constantly throughout Q2, and the median loss per incident across the quarter was $253,250, a figure far more representative of the “typical” hack than the eye-catching nine-figure outliers.
The Biggest Hacks of Q2 2026
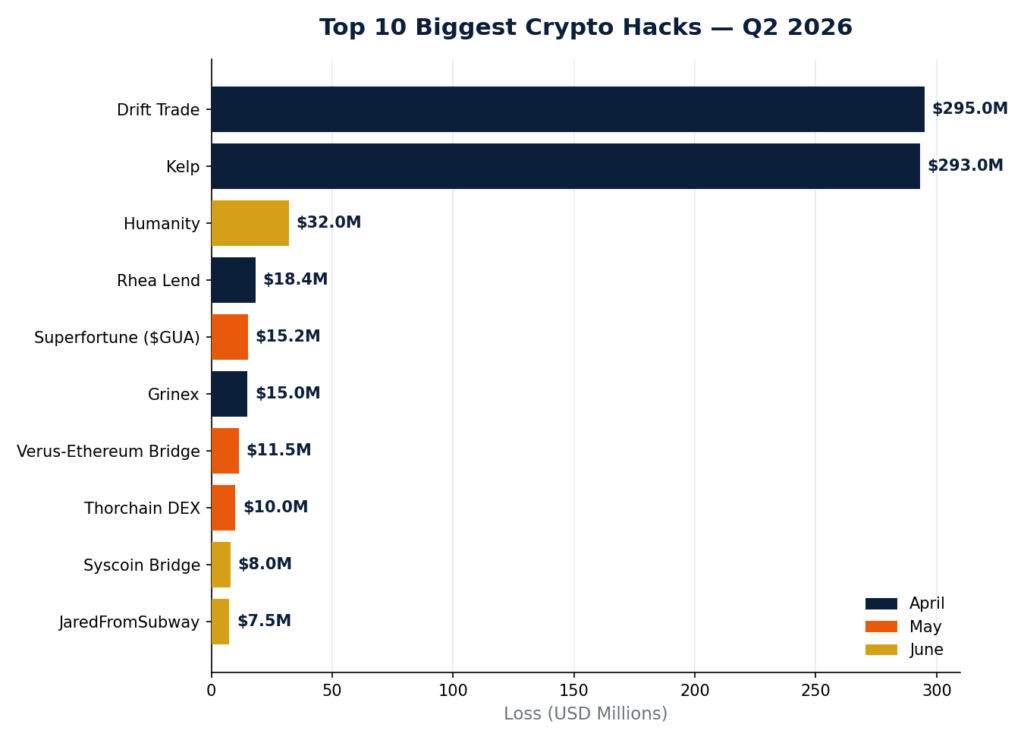
Two hacks in April stand far above everything else this quarter, both crossing the $290 million mark:
- Drift Trade (April, Solana): $295 million. A compromised admin account combined with token price manipulation led to one of the largest single losses of the quarter.
- Kelp (April, Solana): $293 million. Nearly matching Drift Trade in scale, this incident pushed Solana to the top of the quarter’s most-affected chains despite having very few individual incidents.
- Humanity (June, Ethereum-based): $32 million, the largest single loss recorded in June.
- Rhea Lend (April, NEAR): $18.4 million, tied to a logic and slippage exploit in the lending protocol.
- Superfortune / $GUA (May): $15.18 million.
- Grinex (April): $15 million.
- Verus-Ethereum Bridge (May): $11.5 million, another reminder that cross-chain bridges remain a favorite target.
- Thorchain DEX (May): $10 million.
- Syscoin Bridge (June): $8 million.
- JaredFromSubway (June): $7.5 million.
 Top 10 Biggest Crypto Hacks of Q2 2026
Notice how concentrated the damage is at the very top of this list. The gap between the #2 hack (Kelp, $293M) and the #3 hack (Humanity, $32M) is enormous, almost a 9x drop-off. This is a recurring feature of crypto hack data: a couple of infrastructure-level failures at major platforms can single-handedly define an entire quarter’s loss total, while the rest of the list is made up of mid-sized DeFi protocols losing anywhere from a few million down to a few thousand dollars. Even the tenth-largest incident of the quarter, the $7.5 million JaredFromSubway exploit, demonstrated how approval-based attacks can still result in multi-million-dollar losses despite receiving far less attention than the quarter’s mega-hacks. For users of smaller or newer protocols, this doesn’t mean the risk is lower. It simply means the losses are spread across more victims rather than concentrated in one place.
Which Blockchains Took the Biggest Hit?
Breaking losses down by blockchain (accounting for incidents that spanned multiple chains) tells an interesting story about where the money actually disappeared, versus where the number of incidents was highest.
- Solana: $299.2 million (36.8% of total Q2 losses). Despite this being tied to just a handful of incidents, the sheer size of the Drift Trade and Kelp hacks pushed Solana to the top of the loss table.
- Ethereum: $231.0 million (28.4%). Ethereum had by far the highest number of individual incidents of any chain this quarter, reflecting both its dominance in DeFi activity and the sheer surface area of smart contracts deployed on it.
- Arbitrum: $148.3 million (18.3%). A smaller number of incidents, but several were high-value, including flashloan and oracle manipulation exploits.
- BSC (BNB Smart Chain): $33.2 million (4.1%). The second-highest incident count of the quarter, dominated by many smaller-value hacks rather than a few large ones.
- NEAR: $21.9 million (2.7%), BNB Chain: $11.2 million (1.4%), Tron: $9.4 million (1.2%), and a long tail of other chains (Sui, Bitcoin, Monero, Base, Polygon, Secret, TON, and more) making up the remaining 7.1% of losses.
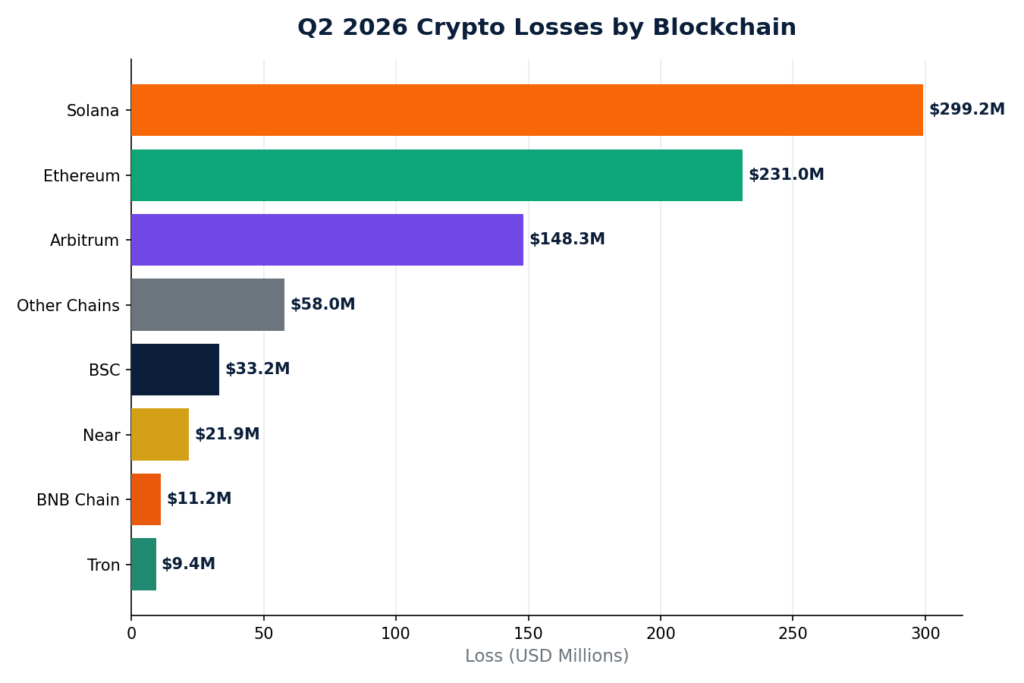 Q2 2026 Crypto Losses by Blockchain
The takeaway here is nuanced. Solana’s top ranking is really a story about two outsized incidents rather than a systemic chain-wide weakness; Solana didn’t have an unusually high number of hacks this quarter. Ethereum, by contrast, saw hacks constantly throughout Q2, which lines up with it hosting the largest and most complex DeFi ecosystem of any chain. BSC’s pattern, many incidents with comparatively modest individual losses, reflects its lower barrier to entry for launching new (and often less-audited) protocols.
What Actually Went Wrong: Attack Categories and Techniques
Looking specifically at incidents where a clear classification was recorded (April and June data, covering 83 of the 124 total incidents), the picture is dominated by one category above all others: Infrastructure failures.
- Infrastructure-related attacks: $639.98 million, 78.8% of total Q2 losses. This includes compromised admin keys, exploited backend systems, and centralized points of failure being taken over directly rather than smart contract code being exploited on-chain.
- Protocol Logic exploits: $69.1 million, 8.5% of total Q2 losses. These are flaws in how a protocol’s smart contracts are actually coded: flash-loan price manipulation, faulty refund logic, broken fee accounting, and similar bugs baked into the contract itself.
- Other classified categories, including Exchange-level compromises, Bridge exploits, Supply Chain attacks, and Smart Contract vulnerabilities, made up the remaining 2.3% combined.
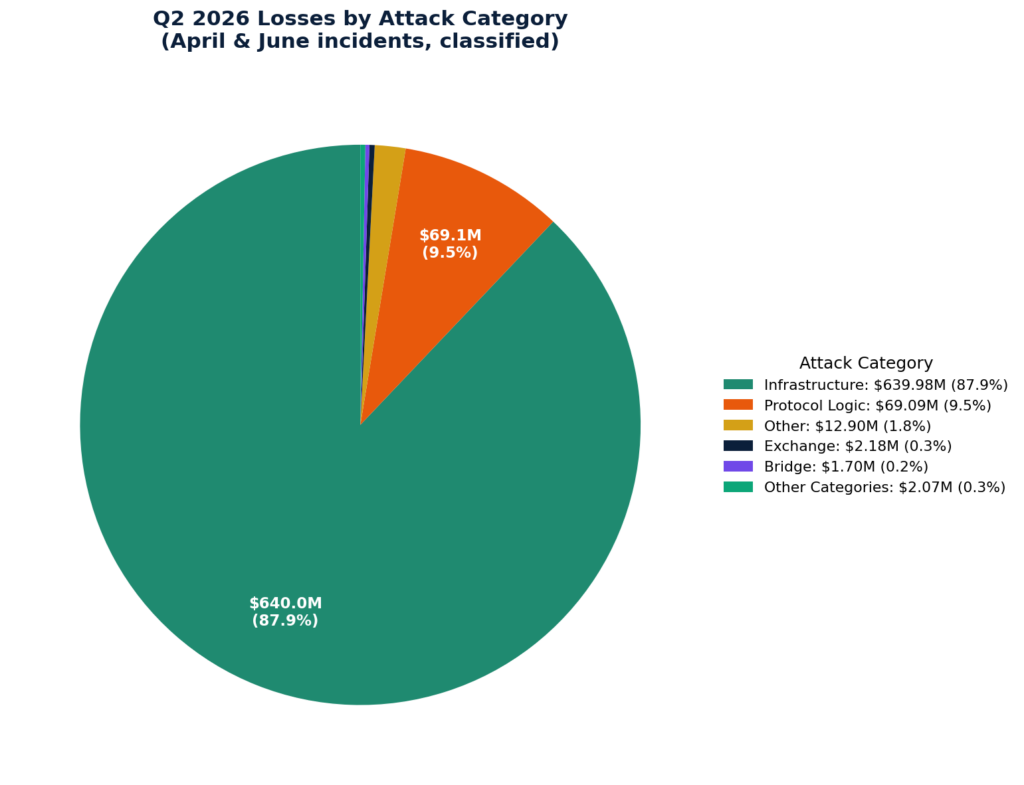 Q2 2026 Losses by Attack Category
This is one of the most important findings in the entire quarter’s data: the overwhelming majority of Q2’s dollar losses came from infrastructure and access-control failures, not exotic smart contract bugs. In other words, most of the money wasn’t stolen because attackers found some brilliant flaw in complex DeFi math. It was stolen because someone gained control of an admin key, a privileged account, or a centralized system that should have been far better protected.
Looking at the most frequently recurring attack techniques across the full quarter (by incident count, not dollar value), the list is led by:
- Smart Contract Vulnerability: 9 incidents
- Access Control Exploit: 7 incidents
- Private Key Compromised / Private Key Leakage: 7 incidents combined
- Flashloan Price Manipulation: 3 incidents
- Admin Key Compromised, Flashloan Exploit, Logic Vulnerability, Bridge Verification Bypass: 2 incidents each
This confirms the pattern from the dollar-value breakdown: access-related failures (private keys, admin controls, whitelisting bypasses) show up constantly across the quarter, both in frequency and in the size of the losses they caused. Flashloan-based manipulation, while less frequent, remains a reliable go-to technique for attackers targeting price oracles and lending logic.
On the programming language side, of the 124 incidents where a language was identifiable, Solidity-based contracts accounted for 45 of the 54 known-language hacks (83%), unsurprising given Solidity’s dominance across Ethereum, BSC, Arbitrum, Polygon, and most EVM-compatible chains. Rust-based protocols (common on Solana and NEAR) accounted for a much smaller share, with isolated incidents also appearing in Move, Cairo, Java, and JavaScript-based systems.
Reading Between the Lines: What Q2 2026 Tells Us
A few clear patterns emerge when you step back and look at the full three-month picture:
- A handful of catastrophic hacks can define an entire quarter. Just two Solana-based incidents in April, Drift Trade and Kelp, accounted for more money than the entirety of May and June combined. This is a reminder that headline “monthly loss” figures can be extremely misleading if you don’t also look at how concentrated the losses are.
- Incident frequency kept climbing even as dollar losses fell. The jump from 38 incidents in April to 45 in June shows attackers didn’t slow down. They simply moved toward a larger number of smaller, often easier targets once the biggest scores had already happened.
- It’s rarely about “hacking” in the dramatic sense. Nearly 79% of classified Q2 losses trace back to infrastructure and access-control failures, such as compromised keys, mismanaged admin permissions, and centralized weak points, rather than sophisticated cryptographic breakthroughs. This matters enormously for how protocols should be prioritizing their security budgets: multi-signature setups, hardware security modules, and strict key-rotation policies would likely have prevented a majority of this quarter’s dollar losses.
- Ethereum’s dominance in incident count reflects its dominance in usage. More activity naturally means more attack surface, and Ethereum-based (and Ethereum-compatible) protocols were targeted far more often than any other ecosystem, even if the very largest individual losses happened elsewhere.
- Median losses tell a more honest story than headline totals. With a median incident loss of just $253,250, the “typical” Q2 hack was nowhere near the scale of Drift Trade or Kelp. Most protocols that got hit lost sums in the tens or low hundreds of thousands of dollars, still devastating for smaller teams and their users, but easy to miss when discussion is dominated by nine-figure outliers.
What This Means for Crypto Users
If you’re holding funds in DeFi protocols, using bridges, or interacting with smart contracts regularly, a few practical takeaways come out of this quarter’s data:
- Favor protocols with strong access-control practices. Since infrastructure and key-compromise failures caused the vast majority of Q2’s dollar losses, a protocol’s operational security (multi-sig treasuries, timelocks, limited admin privileges) matters just as much as its smart contract audit history.
- Don’t assume smaller protocols are “safer” simply because they’re less of a target. June alone saw 45 separate incidents, many on smaller or newer protocols. Attackers clearly didn’t limit themselves to the biggest names.
- Bridges remain a consistent weak point. Verus-Ethereum Bridge and Syscoin Bridge both appear among the quarter’s ten biggest hacks, continuing a long-running trend of cross-chain infrastructure being disproportionately risky.
- Diversify, and avoid concentrating large sums in any single protocol, regardless of chain or reputation. The size of Drift Trade and Kelp’s losses shows that even well-known, heavily used platforms are not immune to catastrophic failure.
Conclusion
Q2 2026 was defined less by an explosion of new hacking techniques and more by the same fundamental weaknesses that have plagued crypto security for years: compromised keys, weak access controls, and centralized points of failure, playing out at a massive scale. April’s back-to-back $290 million-plus incidents on Solana pushed the quarter’s total past $812 million, while May and June showed that even in “quieter” months, dozens of protocols continue to get hit every few weeks.
For an industry that prides itself on decentralization, the data is a pointed reminder: the biggest threats this quarter didn’t come from breaking cryptography or outsmarting smart contract logic. They came from old-fashioned failures in who controls the keys, and that’s a problem every protocol, large or small, can and should be actively working to fix.
Compared with our Q1 2026 Crypto Hack Report, Q2 reinforced many of the same security lessons despite a different distribution of losses. Infrastructure weaknesses, compromised credentials, and access-control failures continued to account for the most financially damaging incidents, underscoring that operational security remains just as critical as smart contract security.


You May Also Like

Ethereum Institutional launched to boost Wall Street adoption after foundation layoffs

Bitcoin Exchange Binance Announces New Listings on its Futures Platform! Here Are the Details