XRP Price: What to Expect Heading Into July 2026 – Key Levels to Watch
TLDR
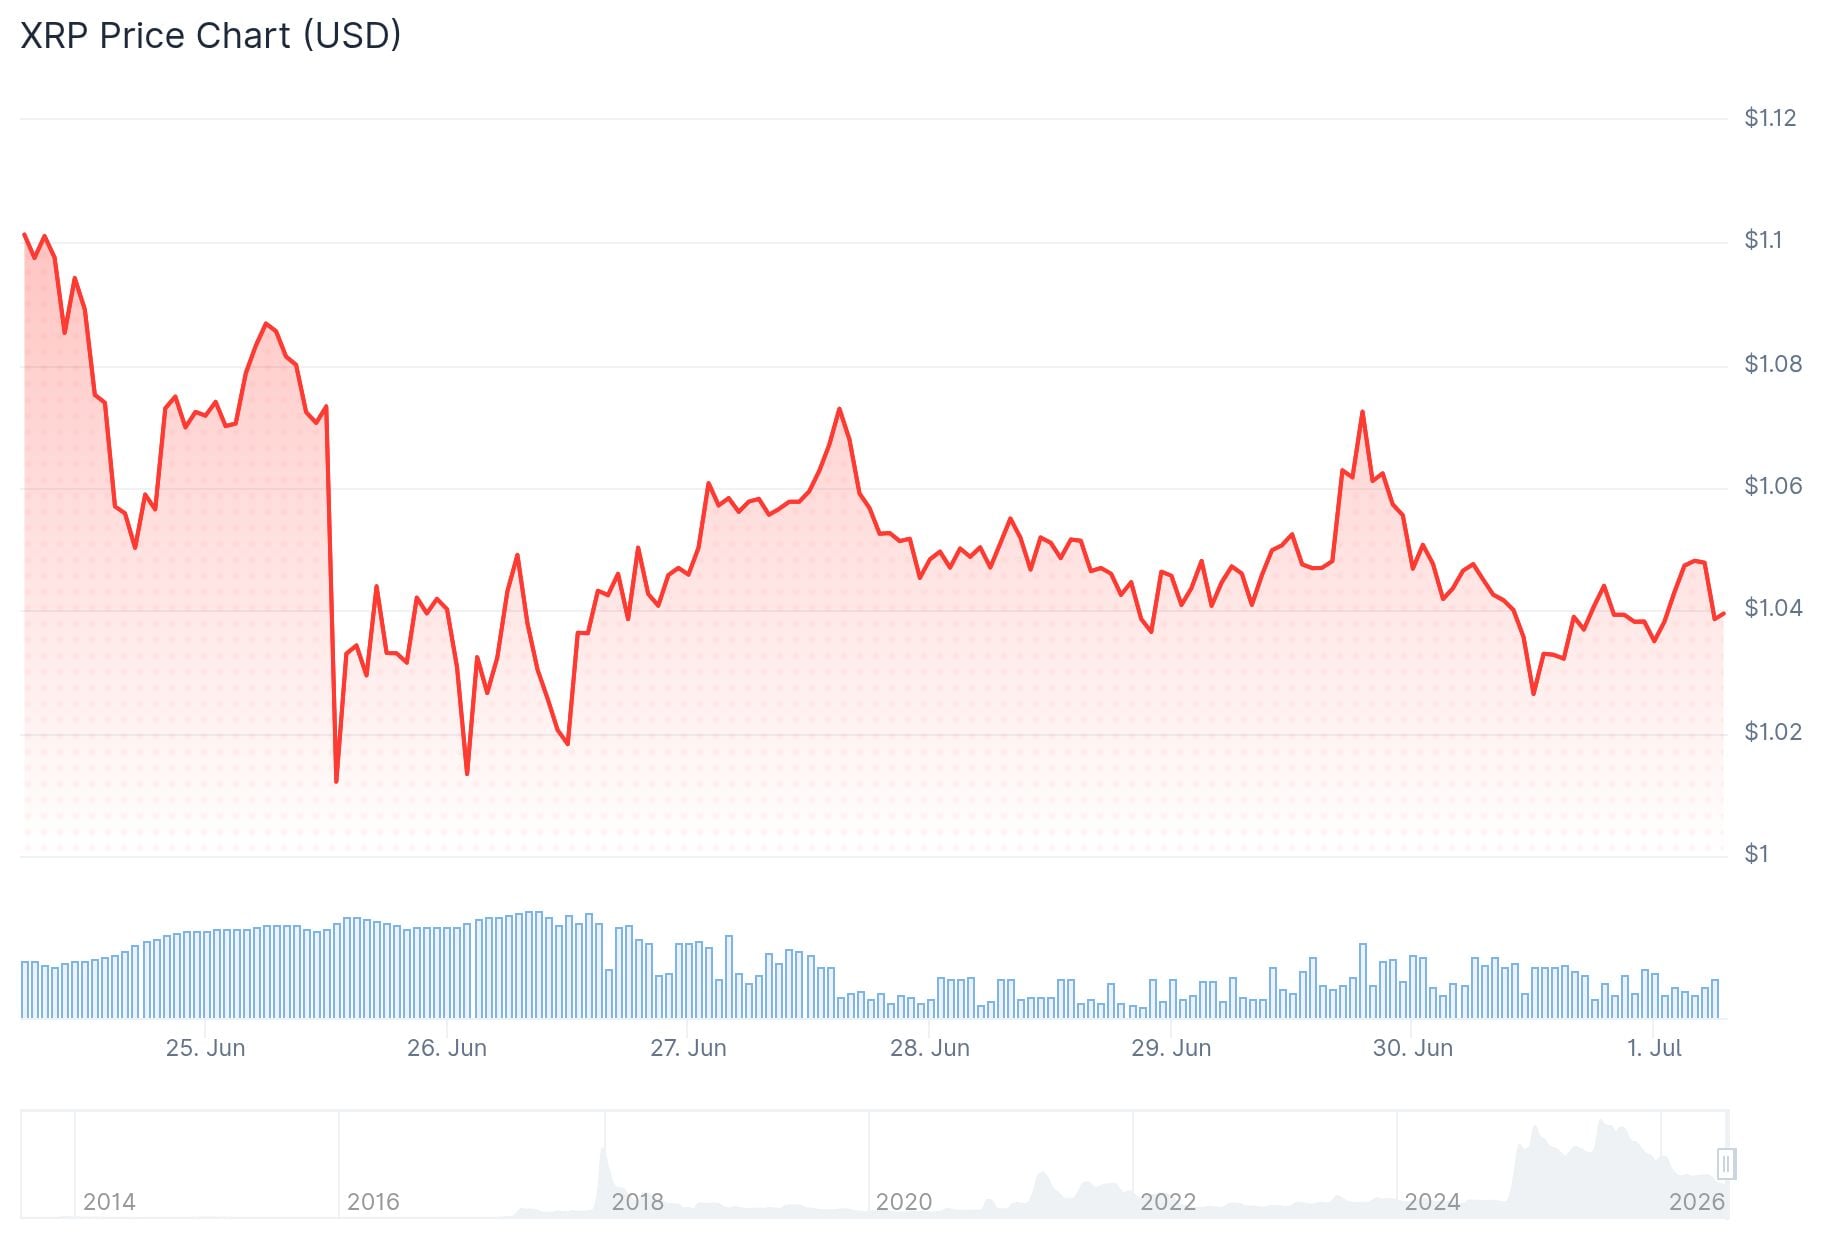
- XRP fell to $1.009 on June 26, its closest brush with $1 since November 2024
- XRP spot ETF inflows stayed positive even as the price dropped
- The daily chart shows XRP in a downtrend dating back to July 2025
- Open Interest has stabilized near 400 million XRP, showing calmer speculative activity
- A daily bullish divergence suggests selling pressure may be easing near $1
XRP fell to $1.009 on June 26, 2026. This was the token’s closest brush with the $1 level since November 2024.
 XRP Price
The drop came even as XRP spot ETFs kept pulling in money. Investors added to these funds while the price fell.
ETF demand is tightening the available XRP supply. That hasn’t translated into price gains under current market conditions.
Broader demand for XRP has thinned out in recent months. Speculative interest has also dropped.
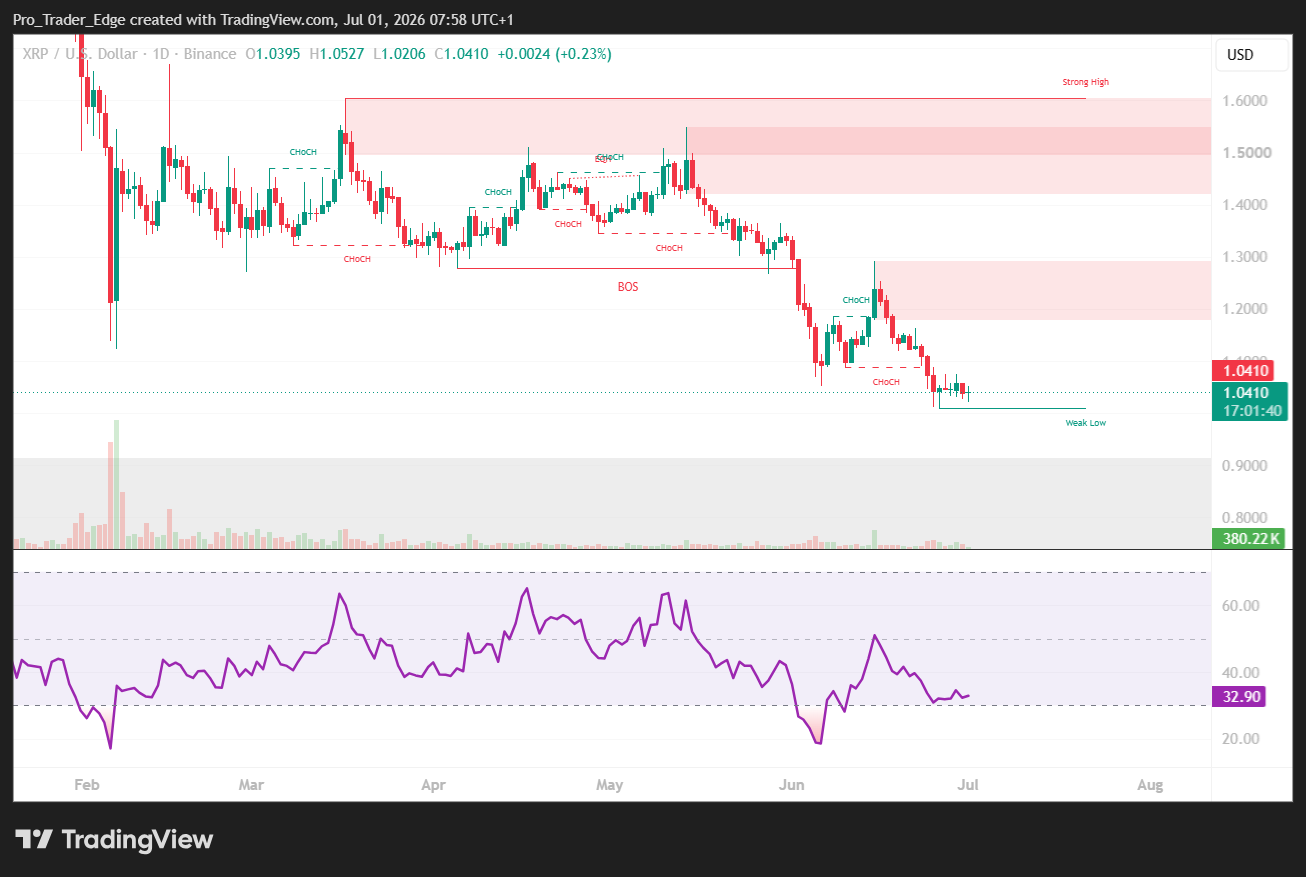
The Technical Picture
The daily chart shows XRP in a downtrend that stretches back to July 2025. In February, the token broke below the April 2025 swing low of $1.61, confirming the bearish trend.
 Source: TradingView
A range pattern held for several months after that. A sharp sell-off at the end of May broke the range and pushed prices lower.
XRP bounced briefly toward $1.30 before falling back to trade near $1.05.
Derivatives data show Open Interest holding steady near 400 million XRP. The Open Interest Turnover Ratio has stayed close to 0.71.
Analyst Arab Chain said traders should watch for spikes in these two metrics. A sudden jump in OI or turnover ratio often signals rising volatility ahead.
On the 4-hour chart, XRP bounced to $1.2935 in mid-June. That move touched the 78.6% Fibonacci retracement level near $1.2985 before sellers stepped back in.
Downside targets sit at $0.975 and $0.854 if the bearish leg continues. A drop below $1 in July was seen as more likely than not.
Signs of Support
A separate read of the chart offers another angle. XRP keeps bouncing from the $0.90 to $1.00 zone, a support area that has held through repeated tests.
The $1.13 level has flipped from support into resistance. Reclaiming it would signal renewed strength.
A bullish divergence on the daily chart has held for about a week. This pattern often points to fading selling pressure rather than a sharp new decline.
On social media, trader Celal Kucuker said XRP will hold its current support and could reach $10 within twelve months, calling it a volatile ride.
Chart analyst ChartNerd pointed to a recurring accumulation pattern seen in past bear markets, noting prior drawdowns of 85% to 96% over 14 to 37 months, compared with the current 72% pullback over 11 months.
For now, $1.00 remains the level to watch. Holding it keeps a retest of $1.13 in play, while losing it opens the door to the $0.87 to $0.90 range.
The post XRP Price: What to Expect Heading Into July 2026 – Key Levels to Watch appeared first on CoinCentral.


You May Also Like

Alabama Enacts Dual Legislative Breakthrough in Blockchain and Judicial Reform
FedEx Stock Slides $12 From Session High as Sellers Take Over