Gold Price Decline Hits 28% From Record — Can $4,000 Hold?
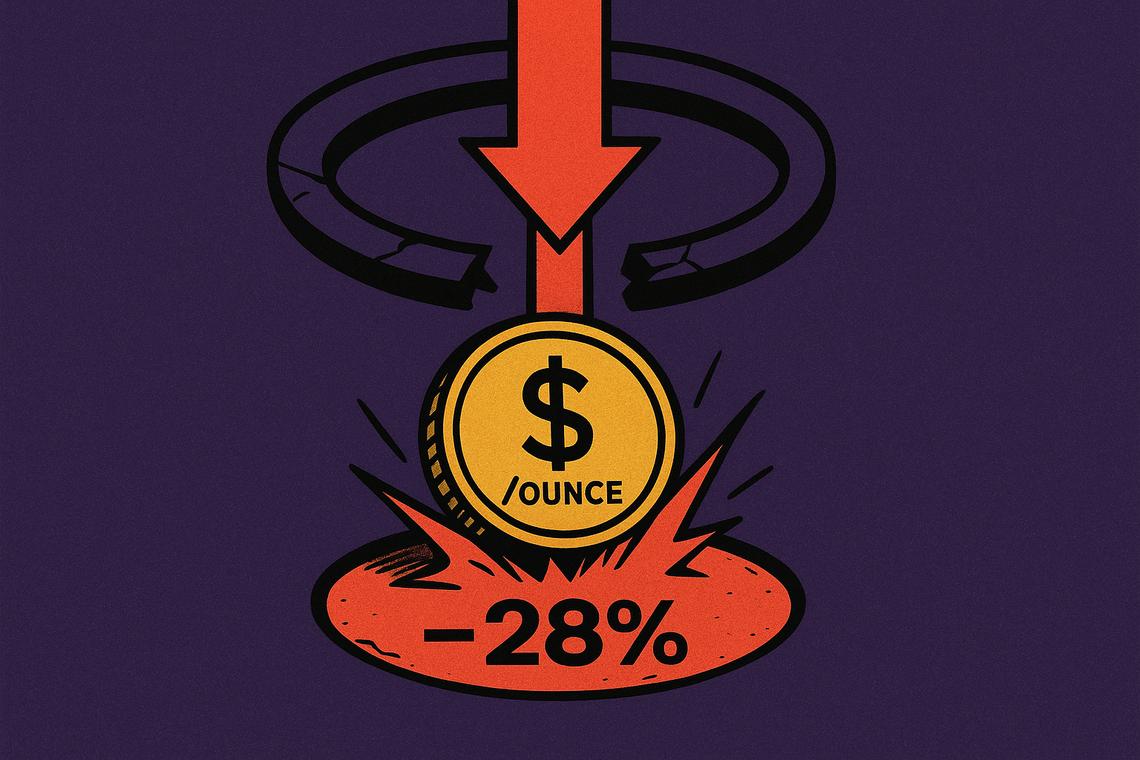
Gold just posted its worst quarterly performance in more than a decade, and the damage has been striking. After surging to an all-time high of $5,598.75 per ounce in January 2026, the precious metal has shed roughly 28% of its value, sliding to around $4,000 by late June 2026. That’s not a routine pullback — it’s a full-scale reversal of one of the most powerful commodity rallies in recent memory.
Key takeaways
- Gold hit a record $5,598.75 per ounce in January 2026, then fell approximately 28% to around $4,000 by late June 2026.
- The past quarter saw an 11% decline — gold’s worst quarterly performance in over a decade, comparable to the steep sell-offs of 2013.
- A strong US dollar, Federal Reserve signals of further rate hikes, easing geopolitical tensions, ETF outflows, and slowing central bank purchases all drove the correction.
- Gold breached its 200-day moving average in June, with daily losses of 1–3% becoming routine.
- Analyst Ed Yardeni identifies $4,000 per ounce as the next major support level for the metal.
Gold’s Record High and the Speed of the Reversal
The January 2026 peak was the product of years of cumulative pressure: persistent inflation, a string of geopolitical crises, and an extraordinary cycle of central bank accumulation that pushed institutional demand to historic levels. At $5,598.75 per ounce, gold looked unstoppable to many on Wall Street. Banks including Bank of America had set price targets as high as $6,000.
That consensus didn’t survive the first quarter intact.
The correction began gradually, then accelerated sharply through June. Daily losses of 1–3% became routine last month, with individual weeks in early June recording declines of 4–5%. Gold breached its 200-day moving average — a line that technical traders watch closely as a signal of longer-term trend health — and touched lows in the $3,980 to $4,022 range. The 11% quarterly drop marks one of the steepest three-month sell-offs since 2013.
What Is Driving the Gold Price Decline
No single factor explains the scale of the reversal. The gold price decline reflects a convergence of macro forces, each one individually manageable but collectively overwhelming for a non-yielding asset.
US Dollar Strength and Federal Reserve Rate Signals
A resurgent US dollar has been the most direct headwind. A stronger dollar makes dollar-denominated commodities more expensive for foreign buyers, compressing global demand. Simultaneously, the Federal Reserve signaled further interest rate increases following what market participants described as an unexpectedly hawkish meeting chaired by Kevin Warsh. Higher rates lift the opportunity cost of holding gold, which pays no dividend or coupon.
Deutsche Bank, responding to the hawkish shift, revised its gold price target to $4,300 per ounce in Q3 if the Fed stays on hold — but warned that three to four additional Fed hikes could push gold as low as $3,800 per ounce. The bank put it bluntly: “hawks are driving out bulls” in the gold market. Bank of America’s commodity strategist Michael Widmer separately noted that the $6,000 target now looks unrealistic given an “uncomfortable” inflation backdrop likely to keep monetary policy tight.
Easing Geopolitical Tensions
Gold’s rise was partly built on fear. The outbreak of the U.S.-Iran war on February 28 initially reinforced gold’s safe-haven status, but that dynamic has since come under pressure as geopolitical conditions have gradually stabilized. As the acute threat premium has faded, one of the key emotional drivers supporting the metal’s valuation has eroded with it.
Central Bank Buying Slowdown and ETF Outflows
For several years, aggressive central bank purchasing provided a structural floor under gold prices. That floor is softening. A slowdown in central bank buying removes one of the most powerful demand anchors the metal has had, and the timing — coinciding with rising yields and a strong dollar — has amplified the price pressure.
On top of that, gold ETF outflows have added meaningful selling pressure as institutional investors rotate capital toward higher-yielding alternatives. When US bond yields rise, fixed-income instruments begin offering meaningful real returns that non-yielding assets simply cannot match. The result is a reallocation that is visible in fund flow data and reflected directly in spot prices.
Market Implications and Analyst Perspectives
At $4,000 per ounce, gold is not cheap in historical terms — it is still trading at historically elevated levels, having given back its most speculative gains without collapsing to pre-rally prices. But the dynamics surrounding it have shifted materially.
The $4,000 Level as a Critical Line
Analyst Ed Yardeni identifies $4,000 per ounce as the next major support level for the metal. The significance of this price point extends beyond technicals: it represents the level at which buyers and sellers are currently locked in a standoff, and where the market will determine whether the correction deepens or stabilizes.
The stakes are real. A decisive break below $4,000 could trigger further ETF redemptions and momentum-driven selling. A hold at this level, on the other hand, could attract value-oriented buyers who view the 28% drawdown as an overcorrection relative to gold’s longer-term fundamentals.
An Asset Allocation Rotation With Staying Power
What makes the current gold price decline particularly meaningful is that it reflects a structural shift in portfolio logic, not just short-term volatility. Rising US bond yields have fundamentally altered the calculus for asset allocators. For years, low and negative real yields made gold’s lack of income irrelevant — now that fixed income pays again, the relative case for gold weakens. Significant ETF outflows confirm that institutional money is actively executing this rotation, not simply sitting on the sidelines.
The slowdown in central bank demand compounds the issue. If that trend continues, the gold market loses a buyer that was largely indifferent to short-term price signals — precisely the kind of steady, structural demand that insulates an asset from speculative swings.
Whether the $4,000 floor holds will depend heavily on the Federal Reserve’s next moves. If rate hike expectations intensify further, the pressure on gold is likely to continue. If the macro narrative softens — slower growth, renewed inflation concerns, or geopolitical escalation — the same forces that drove gold to nearly $5,600 could reassert themselves. For now, though, the metal is fighting to hold a line that, just six months ago, it had left far behind.
FAQ
What caused the recent sharp decline in gold prices?
The decline was driven by a combination of a strong US dollar, Federal Reserve signals of further interest rate increases, easing geopolitical tensions, significant ETF outflows as investors rotated into higher-yielding assets, and a slowdown in central bank buying that had previously provided structural demand support.
How significant was the quarterly drop in gold prices?
Gold’s price dropped 11% in the past quarter, marking its worst quarterly performance in over a decade and one of the steepest three-month sell-offs since 2013.
What is the identified major support level for gold currently?
Analyst Ed Yardeni identifies $4,000 per ounce as the next major support level for gold, a price point where buyers and sellers are currently locked in a standoff after the metal’s roughly 28% decline from its January 2026 all-time high.
How are changes in bond yields affecting gold prices?
Rising US bond yields make fixed-income assets more attractive compared to non-yielding gold. When bonds offer meaningful real returns, institutional investors have less incentive to hold gold, which generates no income — contributing directly to the ETF outflows and price pressure gold has experienced in recent months.
Article produced with the assistance of artificial intelligence and reviewed by the editorial team.


You May Also Like
Fox News chief analyst rips into Trump for getting strung along on major issue

BREAKING: Provenance Blockchain (HASH) Crashes 22% to $0.0104