-
XRP lost key $1.19 support, shifting analyst focus toward the critical $0.84-$0.87 demand zone.
-
CryptoQuant data shows normal derivatives activity, indicating weakness isn't driven by excessive leveraged speculation alone.
-
Dark Defender sees Wave Five nearing completion with bullish RSI divergence forming near historic oversold levels.
XRP price has lost more than 50% of its value over the past year, and is now trading at $1.06. While the drop has shocked investor confidence and sparked fears that the token could fall even further.
Meanwhile, some well-known crypto analysts believe XRP is approaching one of the most important price zones of this cycle before the start of an upward breakout.
XRP Lost a Support, Now All Eyes Are on the $0.87 Zone
According to the XRP chart analyst ChartNerd, the recent drop in XRP price began after it failed to hold the $1.19 support level. That breakdown also pushed the token below its important 0.786 Fibonacci retracement, opening the door for another move lower.
He believes the next major support sits between $0.84 and $0.87, where XRP’s long-term Gaussian Channel and the 0.854 Fibonacci level meet. According to the analyst, this area has historically marked the end of bear markets and the beginning of new upward trends.
The analyst also pointed out that every major XRP bull market, including the rallies in 2017, 2021, and the 2024 breakout, started only after XRP returned to its long-term Gaussian Channel.
That same middle regression band now sits around $0.84, making it one of the most closely watched levels on the chart.
Historical XRP Bear Markets Suggest the Worst May Be Near
Further into the analysis, ChartNerd suggests the current XRP correction may be less severe than previous bear market cycles.
Historically, XRP has experienced declines of 85% to 96%, with bear markets lasting between 400 and 790 days. In comparison, the current downturn has seen a roughly 69% decline over about 11 months, making it relatively shallow.
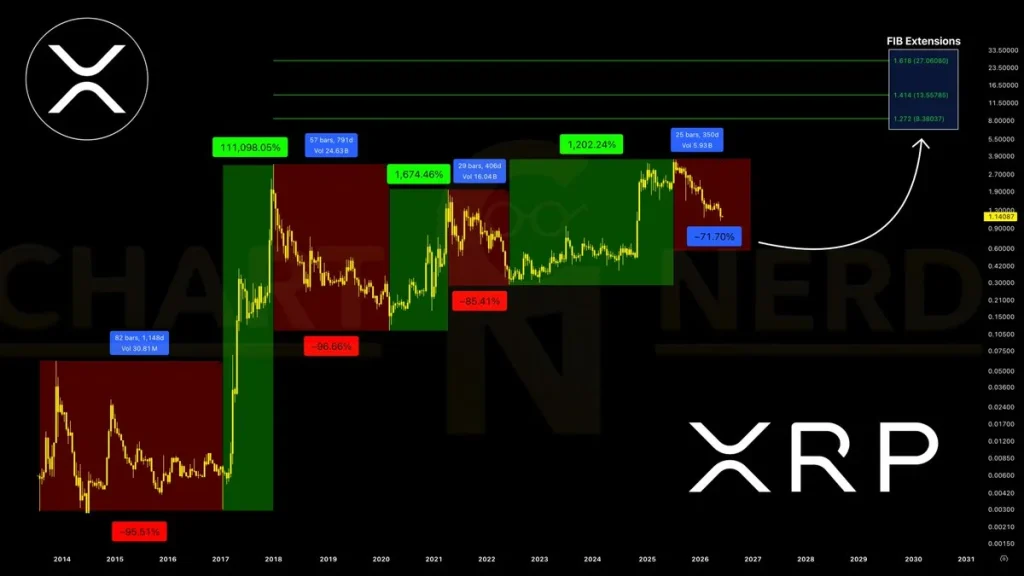
The analyst believes that if XRP finds support in the current zone, attention will shift back toward $1.30 and $1.65. While a drop below the $1 mark may trigger panic among investors.
CryptoQuant Says This Isn’t a Panic-Driven Collapse
While prices continue to weaken, on-chain data suggests traders are not rushing for the exits. According to CryptoQuant, XRP’s Binance Perpetual-Spot Volume Imbalance remains close to normal levels.
The indicator currently shows a Volume Imbalance of around 0.51, while its 30-day Z-Score sits near 0.17.
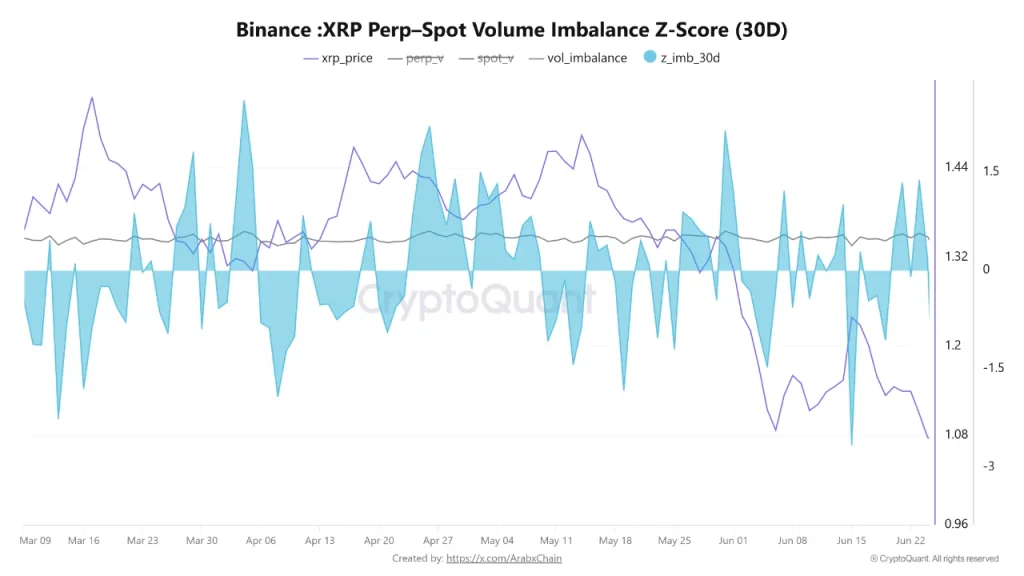
Meanwhile, derivatives trading in XRP has cooled after the strong rally in April and May, while trading activity has now returned to normal levels.
This means that the recent price drop is mainly due to weaker market sentiment rather than heavy liquidations or excessive leverage.
XRP’s Last Dump Before Bull Run Begins
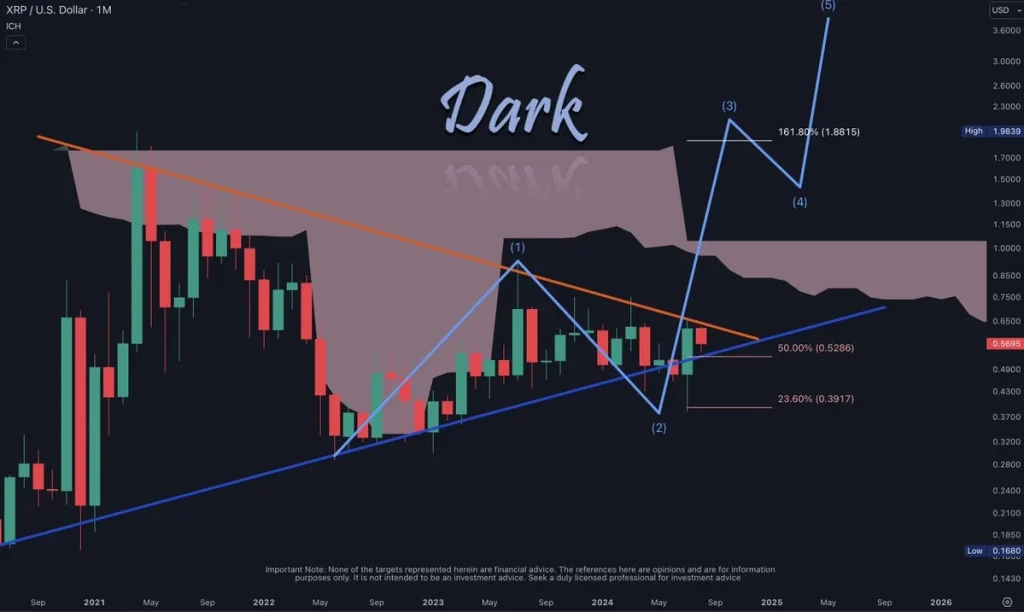
On the other hand, another popular crypto analyst, Dark Defender, says XRP may be completing its final Wave 5 near the $1.05 area. At the same time, the weekly RSI is showing a rare double-dip bullish divergence, a pattern last seen during the 2022 bear market bottom.
Well, ChartNerd also noted that XRP has now spent more than 3,400 days building a long-term base, almost twice as long as the accumulation period before its historic 2017 breakout.
Unlike previous cycles, today’s market also includes institutional partnerships, broader regulatory clarity, growing ETF expectations, and ongoing discussions around the U.S. CLARITY Act.
For now, analysts agree that XRP could still test the $0.84-$0.87 region before finding a durable bottom.
But if history repeats, that same zone could become the foundation for XRP’s next bull run.