

Bitcoin Bear Market 2026: Two On-Chain Signals Say the Bottom Might Already Be In
Bitcoin bear market 2026 data shows OG sellers going quiet and supply in profit breaking cycle lows. Two on-chain signals that smart money watchers are tracking now.
The sellers who have been holding BTC since before most retail traders knew what a wallet was are stepping back. Not because the price has recovered.
Bitcoin has spent most of 2026 grinding lower. Supply in profit, a metric that tracks how many coins are currently worth more than when they last moved, just broke through the trend line that has marked cycle bottoms in every prior bear market. The reading sits at 10.2 million BTC. That is a low not seen at any point in this cycle.
CryptoQuant contributor CW8900, writing on CryptoQuant roughly two hours ago, described the current condition as “the strongest downward pressure in Bitcoin’s history.” Whales are absorbing the sell-side. Retail is capitulating. Both things are true at once.
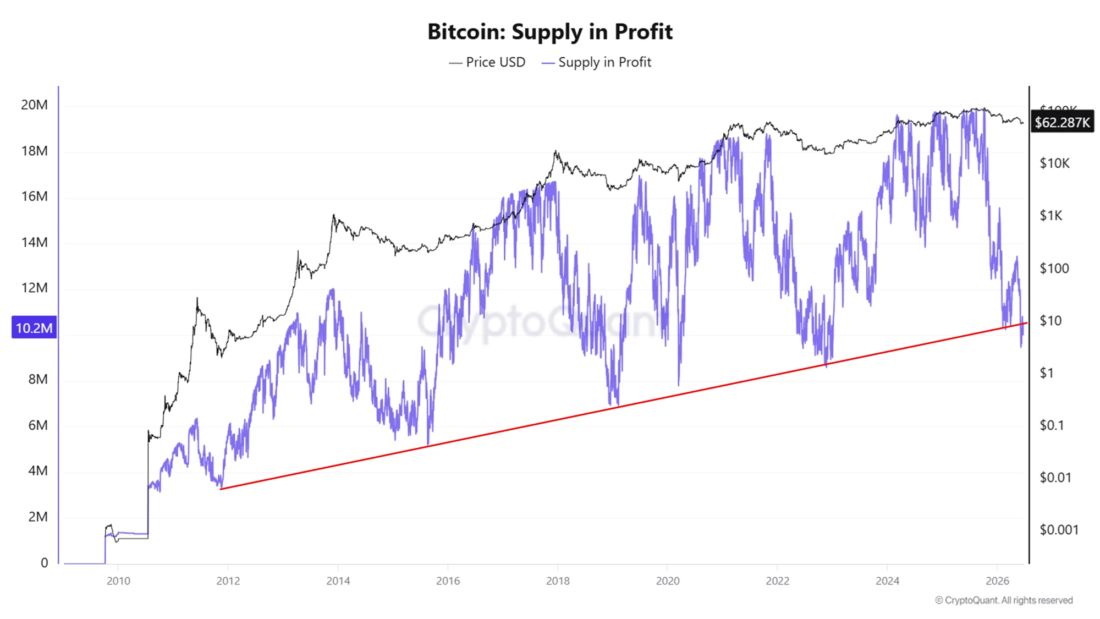
Source: CryptoQuant / CW8900 Bitcoin Supply in Profit with cycle trend line break, current reading: 10.2M BTC
The Trend Line Nobody Wanted to See Break
Each Bitcoin cycle adds slightly more supply to the network. Because of that, the raw Supply in Profit figure trends upward across cycles even without price appreciation. Analysts have used a rising trend line through the prior bear market bottoms as a floor. The current reading has gone below it.
Per CW8900 on CryptoQuant, whales are absorbing selling at record strength. That part of the analysis is being treated as a counter-signal. The interpretation being floated is that experienced buyers are stepping in precisely where newer holders are exiting. Whether that absorption holds is a different question.
Some buyers had clearly been waiting for a number like this. The trend line had held through 2018, 2022. Breaking it was supposed to be the moment everything confirmed the worst.
OG Sellers Went Quiet. That Is the Second Signal.
The other dataset came out about 17 hours earlier. CryptoQuant analyst Darkfost tracked what he calls STXO data from OG holders, that is to say investors who have held BTC for more than five years. When those wallets move their coins, it is usually to sell.
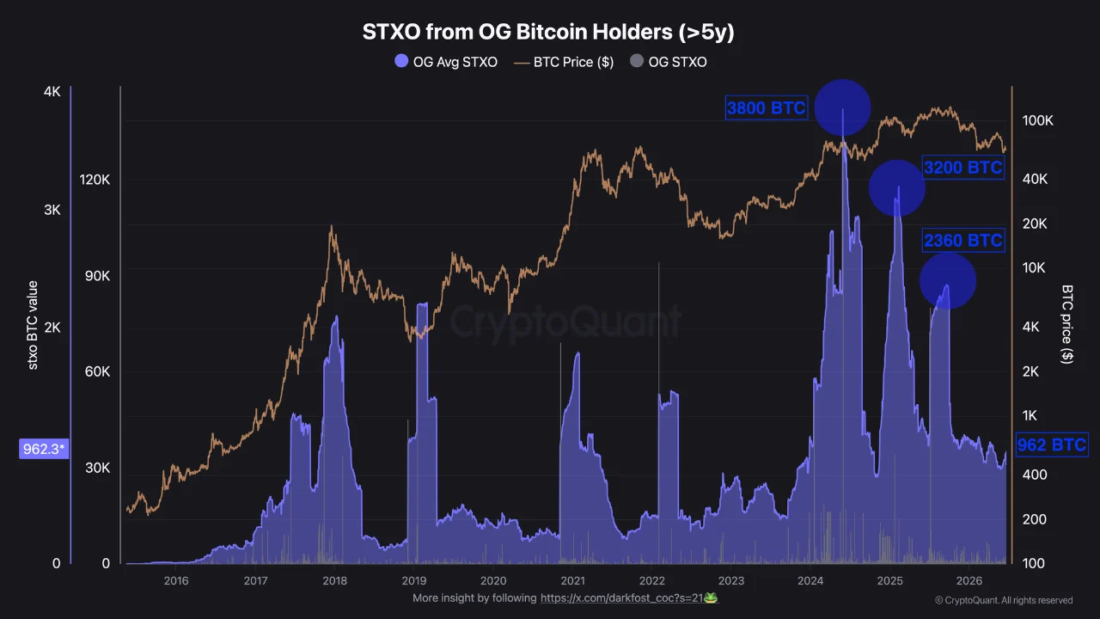
Source: CryptoQuant / Darkfost (x.com/darkfost_coc) STXO from OG Bitcoin Holders (>5y) — 90-day moving average now at 962 BTC, lowest since Nov 2024
Three peaks showed up in this cycle’s data. The first came around May 2024, where the 90-day average hit 3,860 BTC. February 2025 produced a second surge to about 3,200 BTC. A third peak arrived later at 2,360 BTC. On individual days inside those windows, the raw STXO count exceeded 10,000, 30,000, and on the worst day, 142,000 BTC in a single session.
Today that 90-day average, the smoothed measure of how much BTC these long-term holders are pushing out the door, has dropped to 962. Its lowest reading since November 2024. According to Darkfost on CryptoQuant, the most expensive BTC this cohort could have ever paid was around $63,200. That is close to where the market is right now. At that price, they are choosing to hold.
What the Data Does Not Say
A quiet OG cohort and a broken trend line do not confirm a bottom. They are conditions that have historically accompanied bottoms, not guarantees. The difference matters.
Crypto liquidations data published today on livebitcoinnews.com showed $404 million in forced closures, with short positions absorbing most of the damage. Per that analysis, short-term holder SOPR was sitting at 0.998239 as of June 21, just below breakeven. Recent buyers are not in profit.
Bitcoin has also been holding its 200-week moving average, with traders watching a $68,000 to $70,000 liquidity zone as the next major resistance. That level has not been reclaimed.
The Tension in the Numbers
The price looks like a bear market. The behavior of the oldest wallets looks like accumulation. Those two things cannot both be fully right at once. One of them is going to turn out to have been early.
OG holders have been through 2018. They sat through $3,200. The ones who are still around know what a bottom feels like from the inside, which is probably why they stopped selling when they did. Or at least that is what the data says they did.
The 90-day average from the OG cohort. 962 BTC. Per Darkfost.
The post Bitcoin Bear Market 2026: Two On-Chain Signals Say the Bottom Might Already Be In appeared first on Live Bitcoin News.


You May Also Like
Swiss Franc Mixed in Forex Trade: Weakens Against Dollar, Gains on Euro

Coinbase Adds GROVE to Listing Roadmap, Signaling Potential Exchange Debut

CNN analysts floored as Republicans send Trump 'major rebuke' in war powers vote


