

Can Mastercard Stock Clear $499? Bulls Still Have to Prove It

Mastercard stock sits at an interesting juncture after Monday’s sharp recovery to $495.24. The wide-range close near session highs carries weight. However, the daily picture still lacks breakout clarity. The primary bias remains neutral. For now, the burden of proof sits squarely on the bulls.
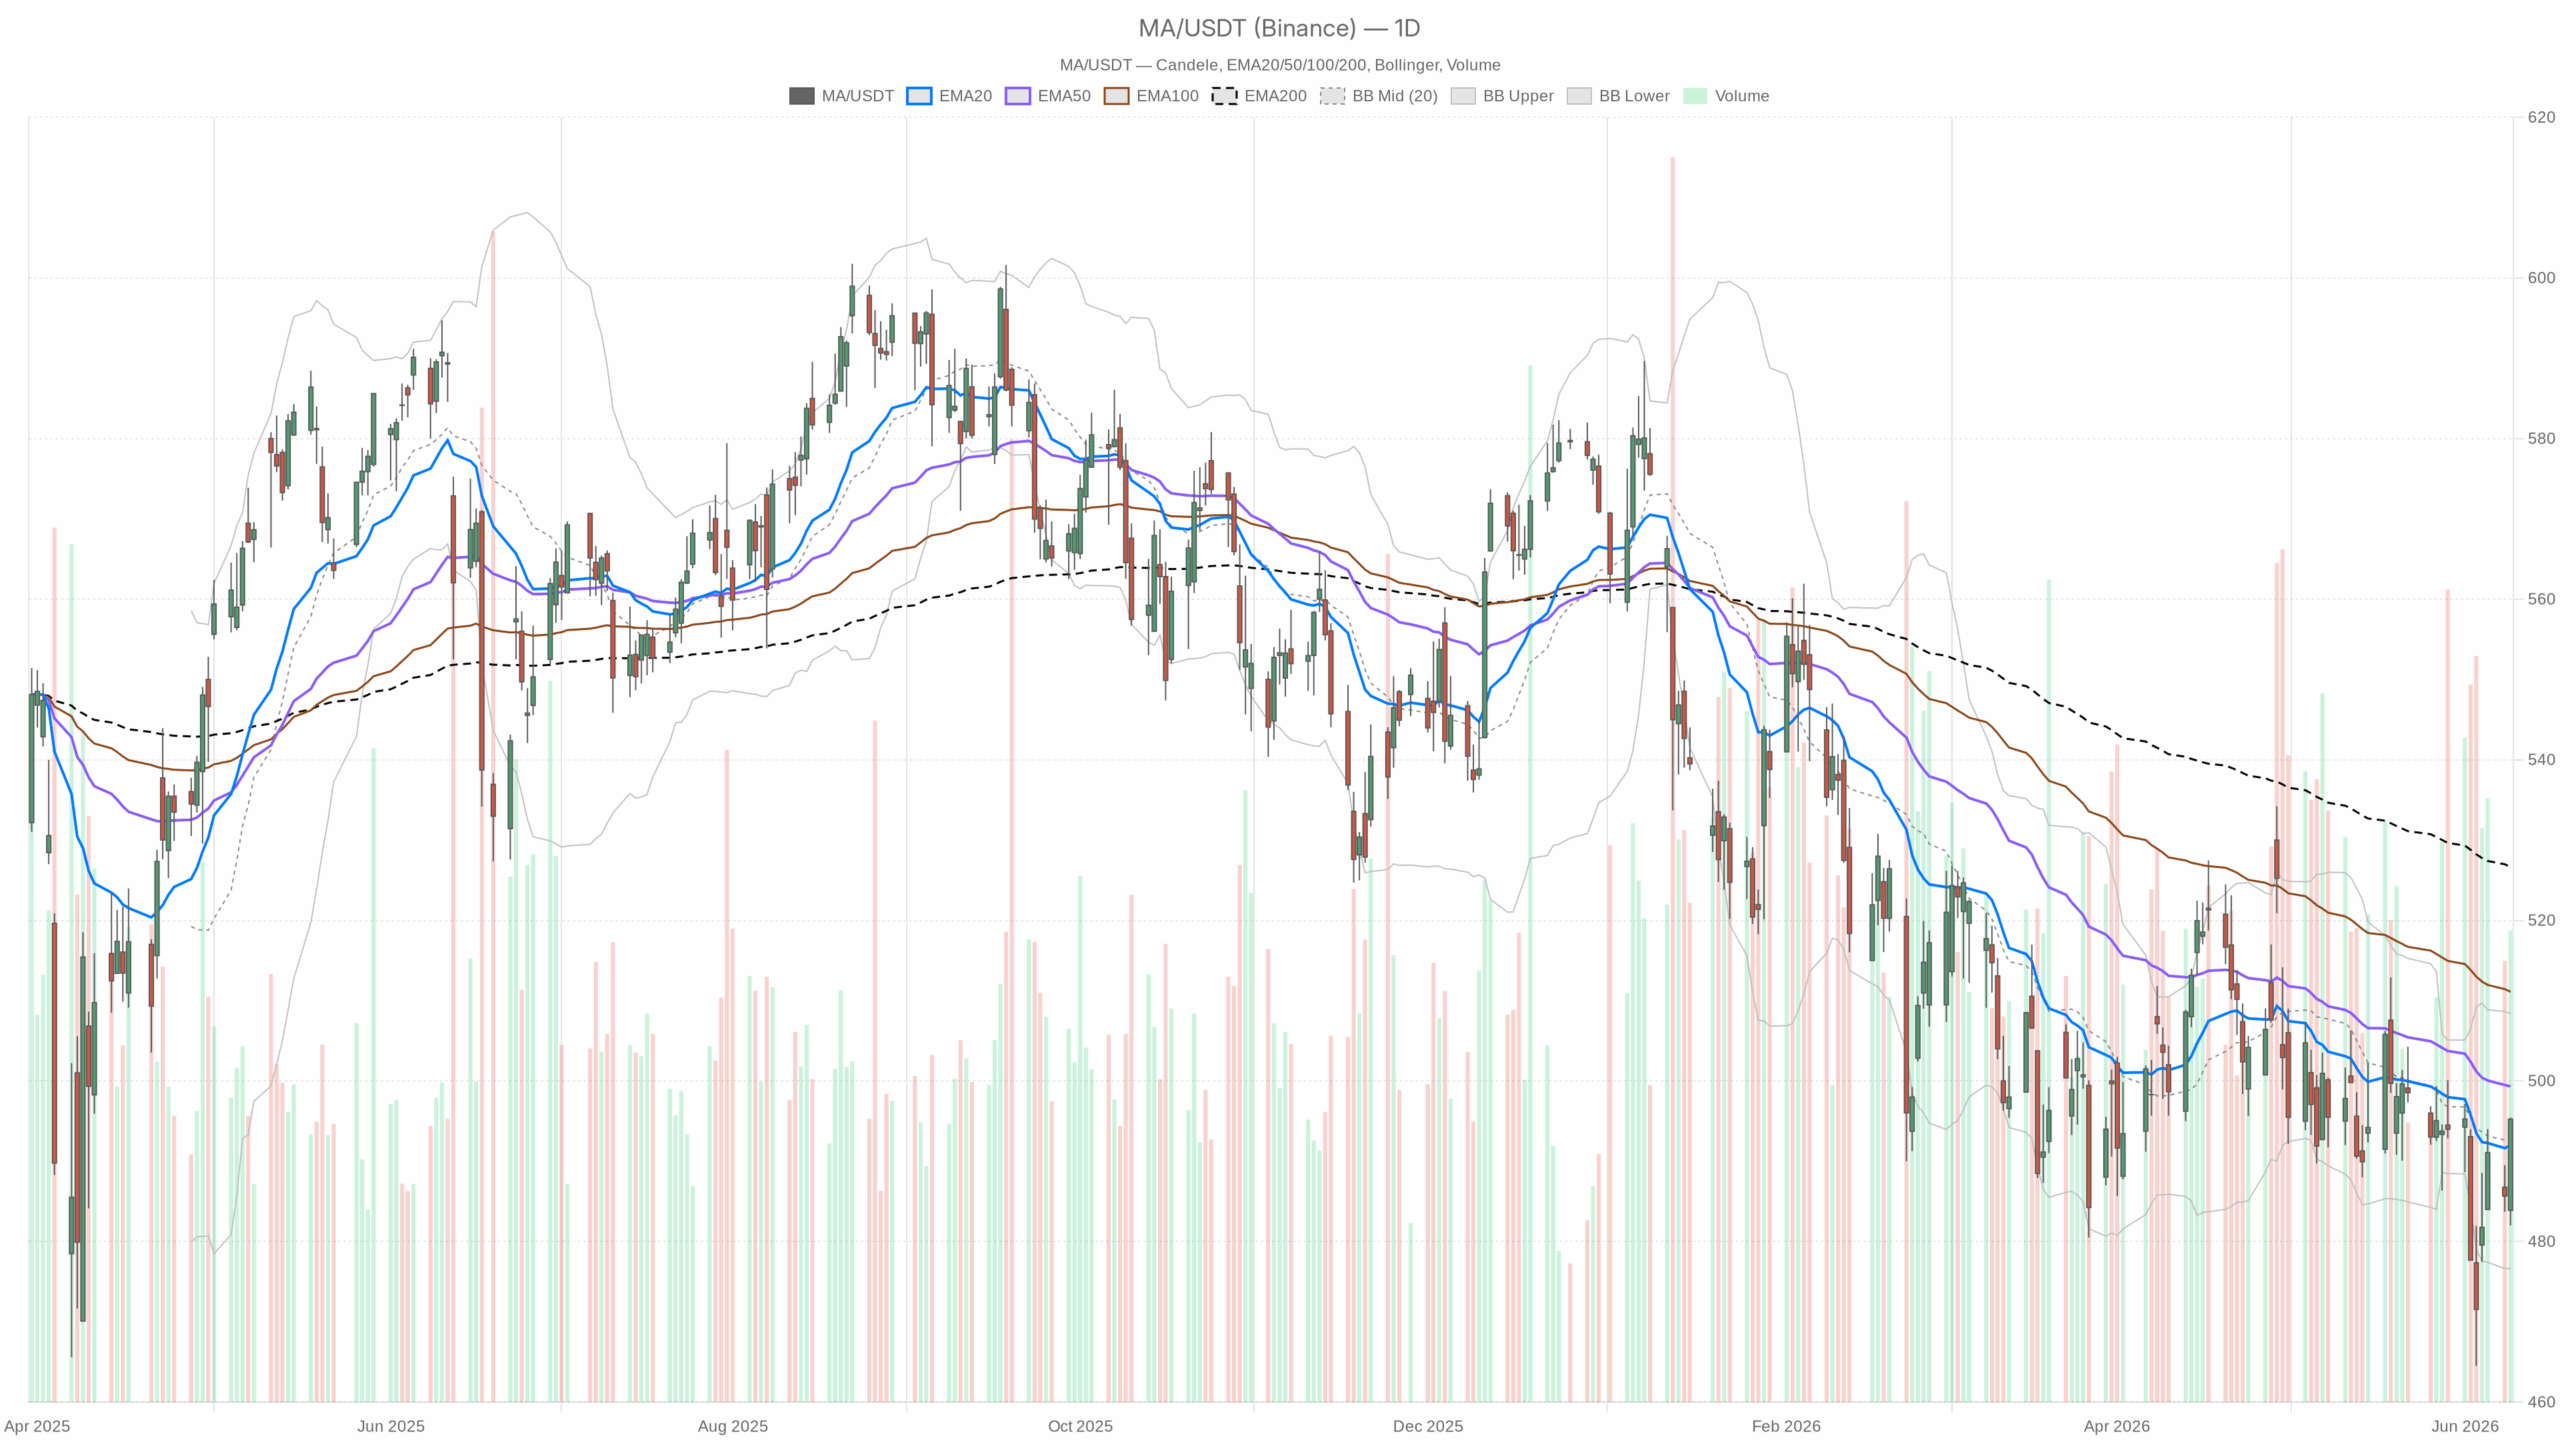 MA — daily chart with candlesticks, EMA20/EMA50 and volume.
Daily Chart: Mastercard Stock Holds Neutral Below Key Resistance
On the daily chart, price is trading between two competing forces. The EMA20 at $491.98 has been reclaimed — a short-term positive. Yet the EMA50 at $499.32 and the EMA200 at $526.66 both sit above current price. Mastercard remains beneath its medium- and long-term trend averages. That structural overhang is the core issue. Until price can clear the EMA50 convincingly, any rally attempt remains a recovery. It would reflect a larger corrective phase rather than a fresh trend leg.
Moving Average and Momentum Structure
The daily MACD tells a nuanced story. The MACD line at -3.96 remains below zero. However, the histogram has turned marginally positive at +0.14. This means the gap between the MACD line and signal line is narrowing. It is not a bullish signal yet. Still, it is an early sign that downside momentum is losing grip. In isolation, that histogram tick is insufficient evidence of a trend reversal. Combined with the price reclaiming the EMA20, though, it hints at stabilization rather than continuation lower.
Daily RSI at 50.89 reinforces the neutral read. The market is neither oversold nor showing RSI momentum associated with sustained uptrends. It sits at the equilibrium level. This effectively tells traders that conviction is absent on both sides at the daily close.
Volatility Context and Range Boundaries
Meanwhile, the Bollinger Bands on the daily frame add useful context. Price closed near the midpoint band at $492.51. The upper band sits at $508.39, while the lower band rests at $476.64. The ATR of 10.71 reflects a moderately volatile environment. A move toward the upper band is plausible in the bullish scenario. However, it would require absorbing the EMA50 resistance along the way. On the downside, the lower Bollinger band near $476.64 and the S1 pivot at $486.35 define the near-term risk boundary.
Hourly Timeframe: Short-Term Momentum Turns Constructive
The 1H chart offers a noticeably more constructive picture. Price at $495.21 sits well above the 1H EMA20 ($489.43) and EMA50 ($488.01). It is also approaching the EMA200 at $494.10 from below. This level appears to be testing and pushing through. The alignment of shorter-term moving averages beneath price is a textbook short-term bullish structure. It confirms that Monday’s daily recovery was not just a wick. There is real hourly follow-through.
The 1H RSI at 64.18 supports this picture. It shows meaningful momentum without yet reaching overbought territory. There is still room to run on the hourly before momentum exhausts. The 1H MACD line at 2.55 versus signal at 1.83 reflects a clearly positive histogram (+0.72). This is consistent with a momentum build rather than a fading bounce. In contrast to the daily MACD, the hourly momentum structure is unambiguously positive.
However, the 1H Bollinger upper band sits at $496.27 — essentially at current price. This is a proximity worth watching. Price pushing against the upper band without a consolidation pause often signals near-term mean reversion risk. The 1H pivot resistance at R1 of $495.88 adds another layer of resistance in this exact zone. Therefore, the short-term setup is bullish in bias but tactically stretched at current levels.
15-Minute Frame: Overbought Signals Warrant Caution on Entries
The 15-minute chart reinforces the short-term bull case on structure. Price sits above all three key EMAs (EMA20: $492.87, EMA50: $490.53, EMA200: $488.12). The regime is flagged as bullish. That is a clean short-term trend picture. On the other hand, the 15m RSI at 72.89 is firmly in overbought territory. The MACD histogram on this timeframe has compressed to just +0.02. This signals that near-term momentum is flattening fast.
Taken together, the 15m signals suggest the immediate trend is intact but the pace of the move is decelerating. This is not an ideal execution entry for new long positions. Traders looking for exposure would be better served waiting for a short-term pullback toward the $492–$493 zone before adding risk.
Macro Backdrop: Consumer Spending and Sector Tailwinds
The macro context surrounding Mastercard carries some relevant signals. American Express’s CFO recently flagged improving card fee revenue and strong credit demand for the remainder of 2026. This comment directly benefits the payments network ecosystem Mastercard operates within. At the same time, JPMorgan’s Marianne Lake has noted that the consumer spending cushion is thinning. The buffer against higher prices continues to erode.
This creates a two-sided narrative. Near-term transaction volumes may remain resilient. However, the medium-term trajectory of consumer spending growth is less certain. Separately, a recent Yahoo Finance article highlighted Mastercard’s EPS growth trajectory as a constructive fundamental case. This provides some underlying support to the valuation argument.
Bullish Scenario for Mastercard Stock
The bullish case builds on Monday’s strong daily candle and the constructive hourly structure. For this scenario to develop, Mastercard stock would need to consolidate above the daily EMA20 near $491–$492. Then it must push through the EMA50 at $499.32. A sustained close above that level would mark the first meaningful recapture of a medium-term trend average. The daily R1 pivot at $499.77 and the Bollinger upper band at $508.39 define logical near-term targets. Continued resilience in consumer credit trends would help. Positive sector momentum from the payments industry would also provide a fundamental tailwind.
Bearish Scenario
In contrast, the bearish case argues the daily recovery is simply a corrective bounce. The larger structure remains bearish. All three major daily EMAs (EMA20, EMA50, EMA200) sit in a stacked downward sequence relative to current price. A failure to hold the EMA20 or a rejection at the EMA50 would quickly shift momentum back to the downside. The daily S1 pivot at $486.35 becomes the first support reference. It is followed by the Bollinger lower band near $476.64. JPMorgan’s warning about eroding consumer spending buffers adds a macro dimension. This could weigh on sentiment if the broader market deteriorates.
Positioning and Outlook
Overall, Mastercard stock is in a recovery phase with genuine short-term momentum. However, a confirmed directional trend at the daily level is not yet in place. The hourly structure is constructive. Yet price is tactically extended against the 1H upper Bollinger band. The 15m RSI is also deep in overbought territory. These are signals that favor patience over aggression in the very near term.
The key level to watch is the EMA50 at $499.32. It represents the line between a genuine trend recovery and a range-bound consolidation. Volatility, as measured by the daily ATR of $10.71, remains elevated enough that both scenarios can play out quickly. Until the EMA50 is cleared, the risk-reward picture is balanced rather than clearly directional.


You May Also Like

DFA says trilateral talks with US, Japan strengthen PHL maritime, economic resilience

Genius Group (GNS) Stock Climbs 8% After Q1 Revenue Soars 171% and Returns to Profit

Joe Scarborough shreds Ted Cruz for questioning Democratic candidate's manhood


