

WTI Price Holds Near $92.00 as 200-SMA on H4 Chart Becomes Key for Bulls
BitcoinWorld
WTI Price Holds Near $92.00 as 200-SMA on H4 Chart Becomes Key for Bulls
West Texas Intermediate crude oil prices are holding steady near the $92.00 mark during early trading on Thursday, with technical traders closely watching the 200-period simple moving average on the 4-hour chart as a pivotal level for the next directional move. The commodity has found support after a recent pullback, and the moving average now serves as both a potential launchpad for further gains and a critical line of defense for the bullish trend.
Technical Setup: The 200-SMA as a Key Threshold
The 200-SMA on the H4 timeframe has historically acted as a reliable dynamic support and resistance zone for WTI. As of the latest session, the price is testing this level from above, suggesting that buyers are attempting to maintain control. A decisive hold above the moving average could open the path toward the next resistance cluster near $93.50, while a breakdown below would likely trigger a test of the $90.50 support area, where the 50-SMA on the daily chart converges.
Trading volumes have been moderate, with the market digesting mixed signals from global demand forecasts and supply-side adjustments. The recent inventory data from the U.S. Energy Information Administration showed a smaller-than-expected draw, which initially pressured prices, but geopolitical risk premiums and ongoing OPEC+ production restraint have provided a floor.
Broader Market Context and Fundamentals
The $92.00 level itself carries psychological significance, having acted as both support and resistance over the past month. Beyond the technicals, traders are weighing the impact of a stronger U.S. dollar, which typically weighs on dollar-denominated commodities like oil, against tightening global spare capacity. The International Energy Agency’s latest monthly report highlighted that global oil inventories remain below the five-year average, which continues to underpin prices.
Furthermore, the market is closely watching the outcome of the upcoming OPEC+ meeting, where any signal of a production increase could shift the supply-demand balance. For now, the combination of a resilient U.S. economy and persistent supply constraints is keeping the bullish narrative intact, but the 200-SMA on the H4 chart remains the immediate technical battleground.
What This Means for Traders and Investors
For short-term traders, the current price action near the 200-SMA offers a clear risk-management framework: a sustained move above $92.30 with strong volume could be seen as a bullish continuation signal, while a close below $91.60 would suggest weakening momentum. Medium-term investors, however, should note that the broader uptrend from the $85.00 lows remains intact as long as the price stays above the 200-day moving average on the daily chart, currently near $88.50.
The energy sector’s sensitivity to macroeconomic data means that Friday’s U.S. non-farm payrolls report could also influence WTI’s direction, as stronger employment figures would reinforce demand optimism. Conversely, any signs of economic cooling could accelerate profit-taking.
Conclusion
WTI crude oil’s ability to hold near $92.00 and defend the 200-SMA on the H4 chart is the defining technical story for the session. While the fundamental backdrop remains supportive, the price action at this juncture will likely determine whether the commodity resumes its upward trajectory or undergoes a deeper correction. Traders should monitor the moving average closely for confirmation of the next directional bias.
FAQs
Q1: Why is the 200-SMA on the H4 chart important for WTI price?
The 200-period simple moving average on the 4-hour chart is a widely followed technical indicator that acts as dynamic support or resistance. When WTI holds above it, the trend is considered bullish; a break below often signals a potential reversal or deeper correction.
Q2: What is the next key resistance level for WTI if it breaks above $92.00?
If WTI sustains a move above $92.30, the next resistance zone is around $93.50, which corresponds to a previous swing high from late October. A breakout above that level could target the $95.00 psychological barrier.
Q3: How do fundamental factors like OPEC+ decisions affect the technical outlook?
Fundamental events such as OPEC+ production announcements can cause sharp price movements that break technical levels. Traders use technical analysis to identify entry and exit points, but they must always consider fundamental catalysts that can invalidate chart patterns.
This post WTI Price Holds Near $92.00 as 200-SMA on H4 Chart Becomes Key for Bulls first appeared on BitcoinWorld.


You May Also Like
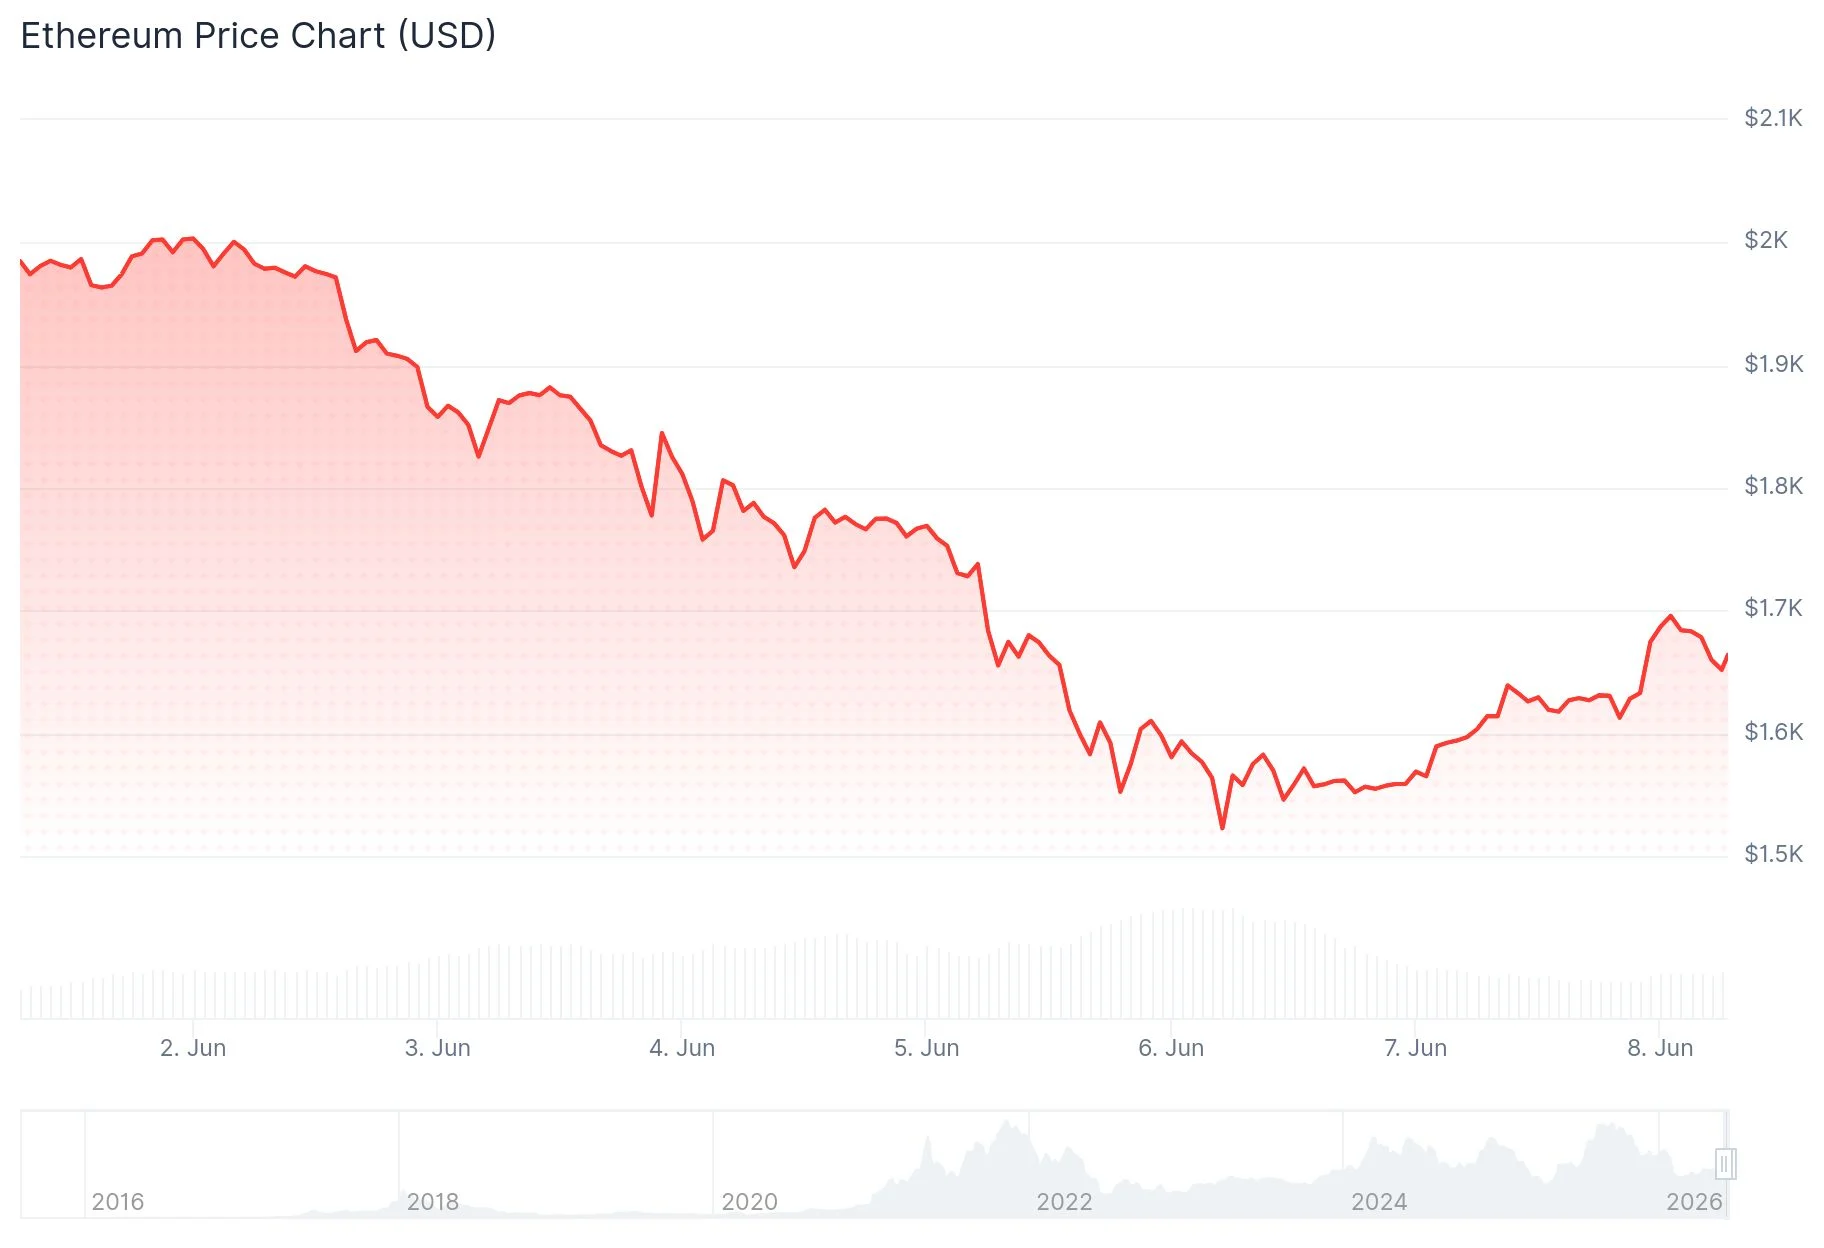
Ethereum (ETH) Crashes to $1,500 — Can Bulls Defend or Is $1,000 Coming?

Arthur Hayes says ‘I Didn’t Buy’ amid $2M HYPE transfer

Bitcoin Options Skew Turns Bearish: What the $60K Put Wall Says After the Washout


