

XRP Monthly RSI Hits 42.7 a Level That Preceded Every Major Rally
XRP is approaching a technical level that has appeared only a few times in its history. According to analysts, XRP’s monthly Relative Strength Index (RSI) has fallen to 42.7. This level was previously recorded in 2015, 2020 and 2022. Each of those instances was followed by a significant price rally. The signal comes as XRP faces heavy selling pressure across the broader crypto market.
At the time of writing, XRP current price stands near $1.13, down almost 14% over the past week. But some analysts believe the latest RSI reading could indicate that bearish momentum is nearing exhaustion. The setup has quickly become one of the most discussed topics in XRP news today.
Historical Pattern Suggests Potential Rebound
Analysis highlights a recurring pattern across multiple market cycles. In November 2015, XRP’s monthly RSI dropped to 46.7 before the asset entered the rally that eventually fueled its explosive 2017 bull run. The same pattern emerged during the March 2020 market crash. XRP’s RSI fell to 43.7 while the token traded near $0.10. Within a year, XRP surged to nearly $2.
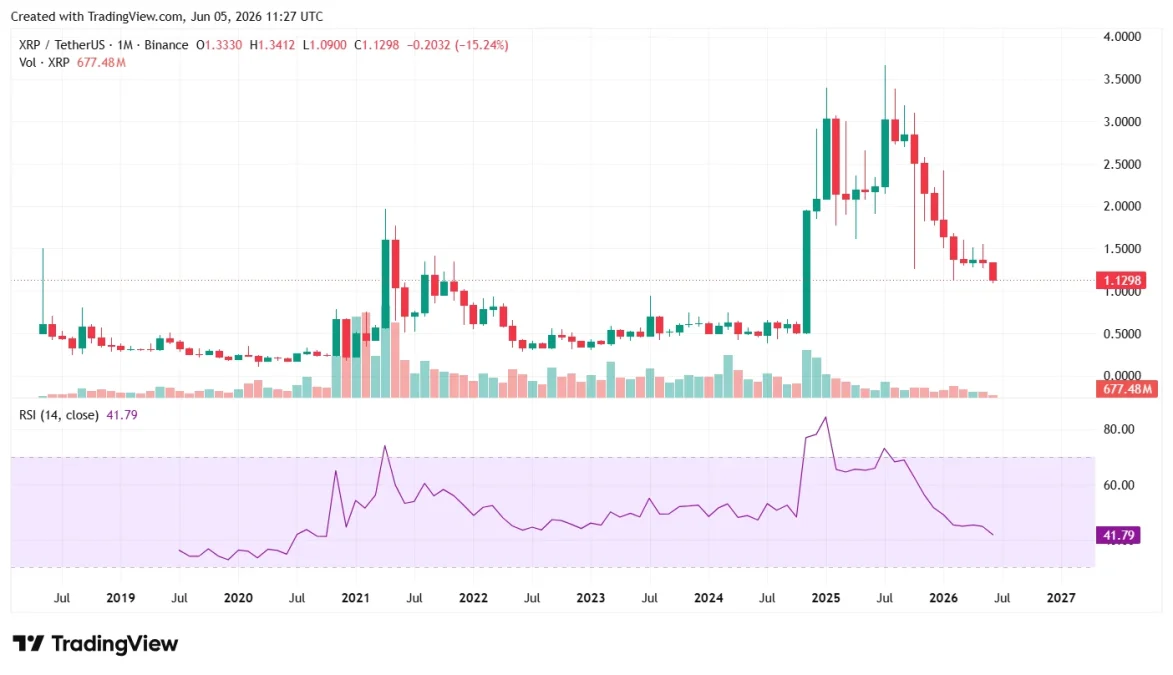
Chart: XRP monthly RSI nears a historically bullish level. Source: TradingView
A similar setup appeared again in August 2022. The RSI dropped near 43.9 before XRP recovered. It eventually reached a cycle high of $3.39 in January 2025. Now, the indicator has returned to a comparable level. According to analysts, every major XRP rally began after momentum reached these deeply depressed zones.
Long-Term Ascending Channel Remains Intact
What makes the current setup more notable is XRP’s position within its long term price structure. Despite recent weakness, XRP continues to trade above the lower boundary of an ascending channel. That has guided price action since 2017. Over the years, XRP has repeatedly bounced from this support zone before moving toward the channel’s upper resistance.
The combination of structural support and a historically low RSI is strengthening bullish sentiment among long term traders. Some technical projections suggest that if history repeats, XRP could eventually revisit the upper end of the channel. While such targets remain speculative, analysts are closely watching whether support continues to hold.
XRPL Upgrade Adds Fundamental Support
Beyond technical indicators, the XRP ecosystem continues to evolve. The XRP Ledger core team recently announced the upcoming 3.2.0 upgrade. The update will rename the network’s main server software from “rippled” to “xrpld.” It requires validators and node operators to upgrade their infrastructure.
The change follows May’s 3.1.3 reliability improvements and is designed to modernize network operations. Although the upgrade does not directly impact its tokenomics. It represents another step forward for the network’s infrastructure. The development has received attention across the Ripple XRP news community as developers prepare for implementation.
How This Affects Developers and Investors
For developers, the upcoming XRPL upgrade provides a stronger infrastructure foundation. Improved network operations and modernization efforts could support future protocol enhancements and enterprise adoption.
For investors, the current setup presents a mix of risk and opportunity. Short term price action remains weak, and XRP continues to face pressure from the broader market downturn. But the return of a historically significant RSI level is encouraging long term bulls.
The latest XRP price forecast discussions are increasingly focused on whether the asset can defend the critical $1.10 support zone. A successful defense could trigger a recovery toward higher resistance levels. Conversely, a breakdown may open the door for further downside.
Traders Watch Key Support Zone
The current market environment remains challenging. XRP recently lost major support near $1.28 and continues to trade below key moving averages. Still, the combination of a rare monthly RSI reading, long term channel support and ongoing ecosystem development. That is attracting attention from traders and investors alike.
Whether this signal produces another historic rally remains uncertain. But one fact stands out clearly. Every previous time XRP’s monthly RSI entered this zone, a major recovery eventually followed. That is why many market participants are watching this level more closely than ever.
The post XRP Monthly RSI Hits 42.7 a Level That Preceded Every Major Rally appeared first on Coinfomania.


You May Also Like

Bitcoin and Ethereum Open Interest Tumbles to Multi-Month Lows After Brutal Selloff

Ethereum Price Nears Critical Support as Analysts Watch $1,900 Reclaim

Drift Protocol Breach Triggers Up to $285 Million Losses


