

Ethereum price today falls below $1,770, bearish trend and high volatility dominate the market

Ethereum is in one of the most delicate moments of recent months. The ETH price today is at $1,768.96, a level that is not just a number: it is the snapshot of an asset that has systematically lost ground, that is trading below every relevant moving average and that is still attracting sellers despite an RSI already deep in oversold territory. The question is not whether the trend is bearish — it clearly is — but whether this point represents an opportunity or simply a trap for those looking for a rebound at all costs.
The macro context does not help: total crypto market capitalization has lost 4.67% in the last 24 hours, Bitcoin dominates with over 55% dominance and the Fear & Greed Index is at 12 — Extreme Fear. When fear reaches these levels, price movements stop following pure technical logic and begin to reflect the emotional pressure of capitulating holders.
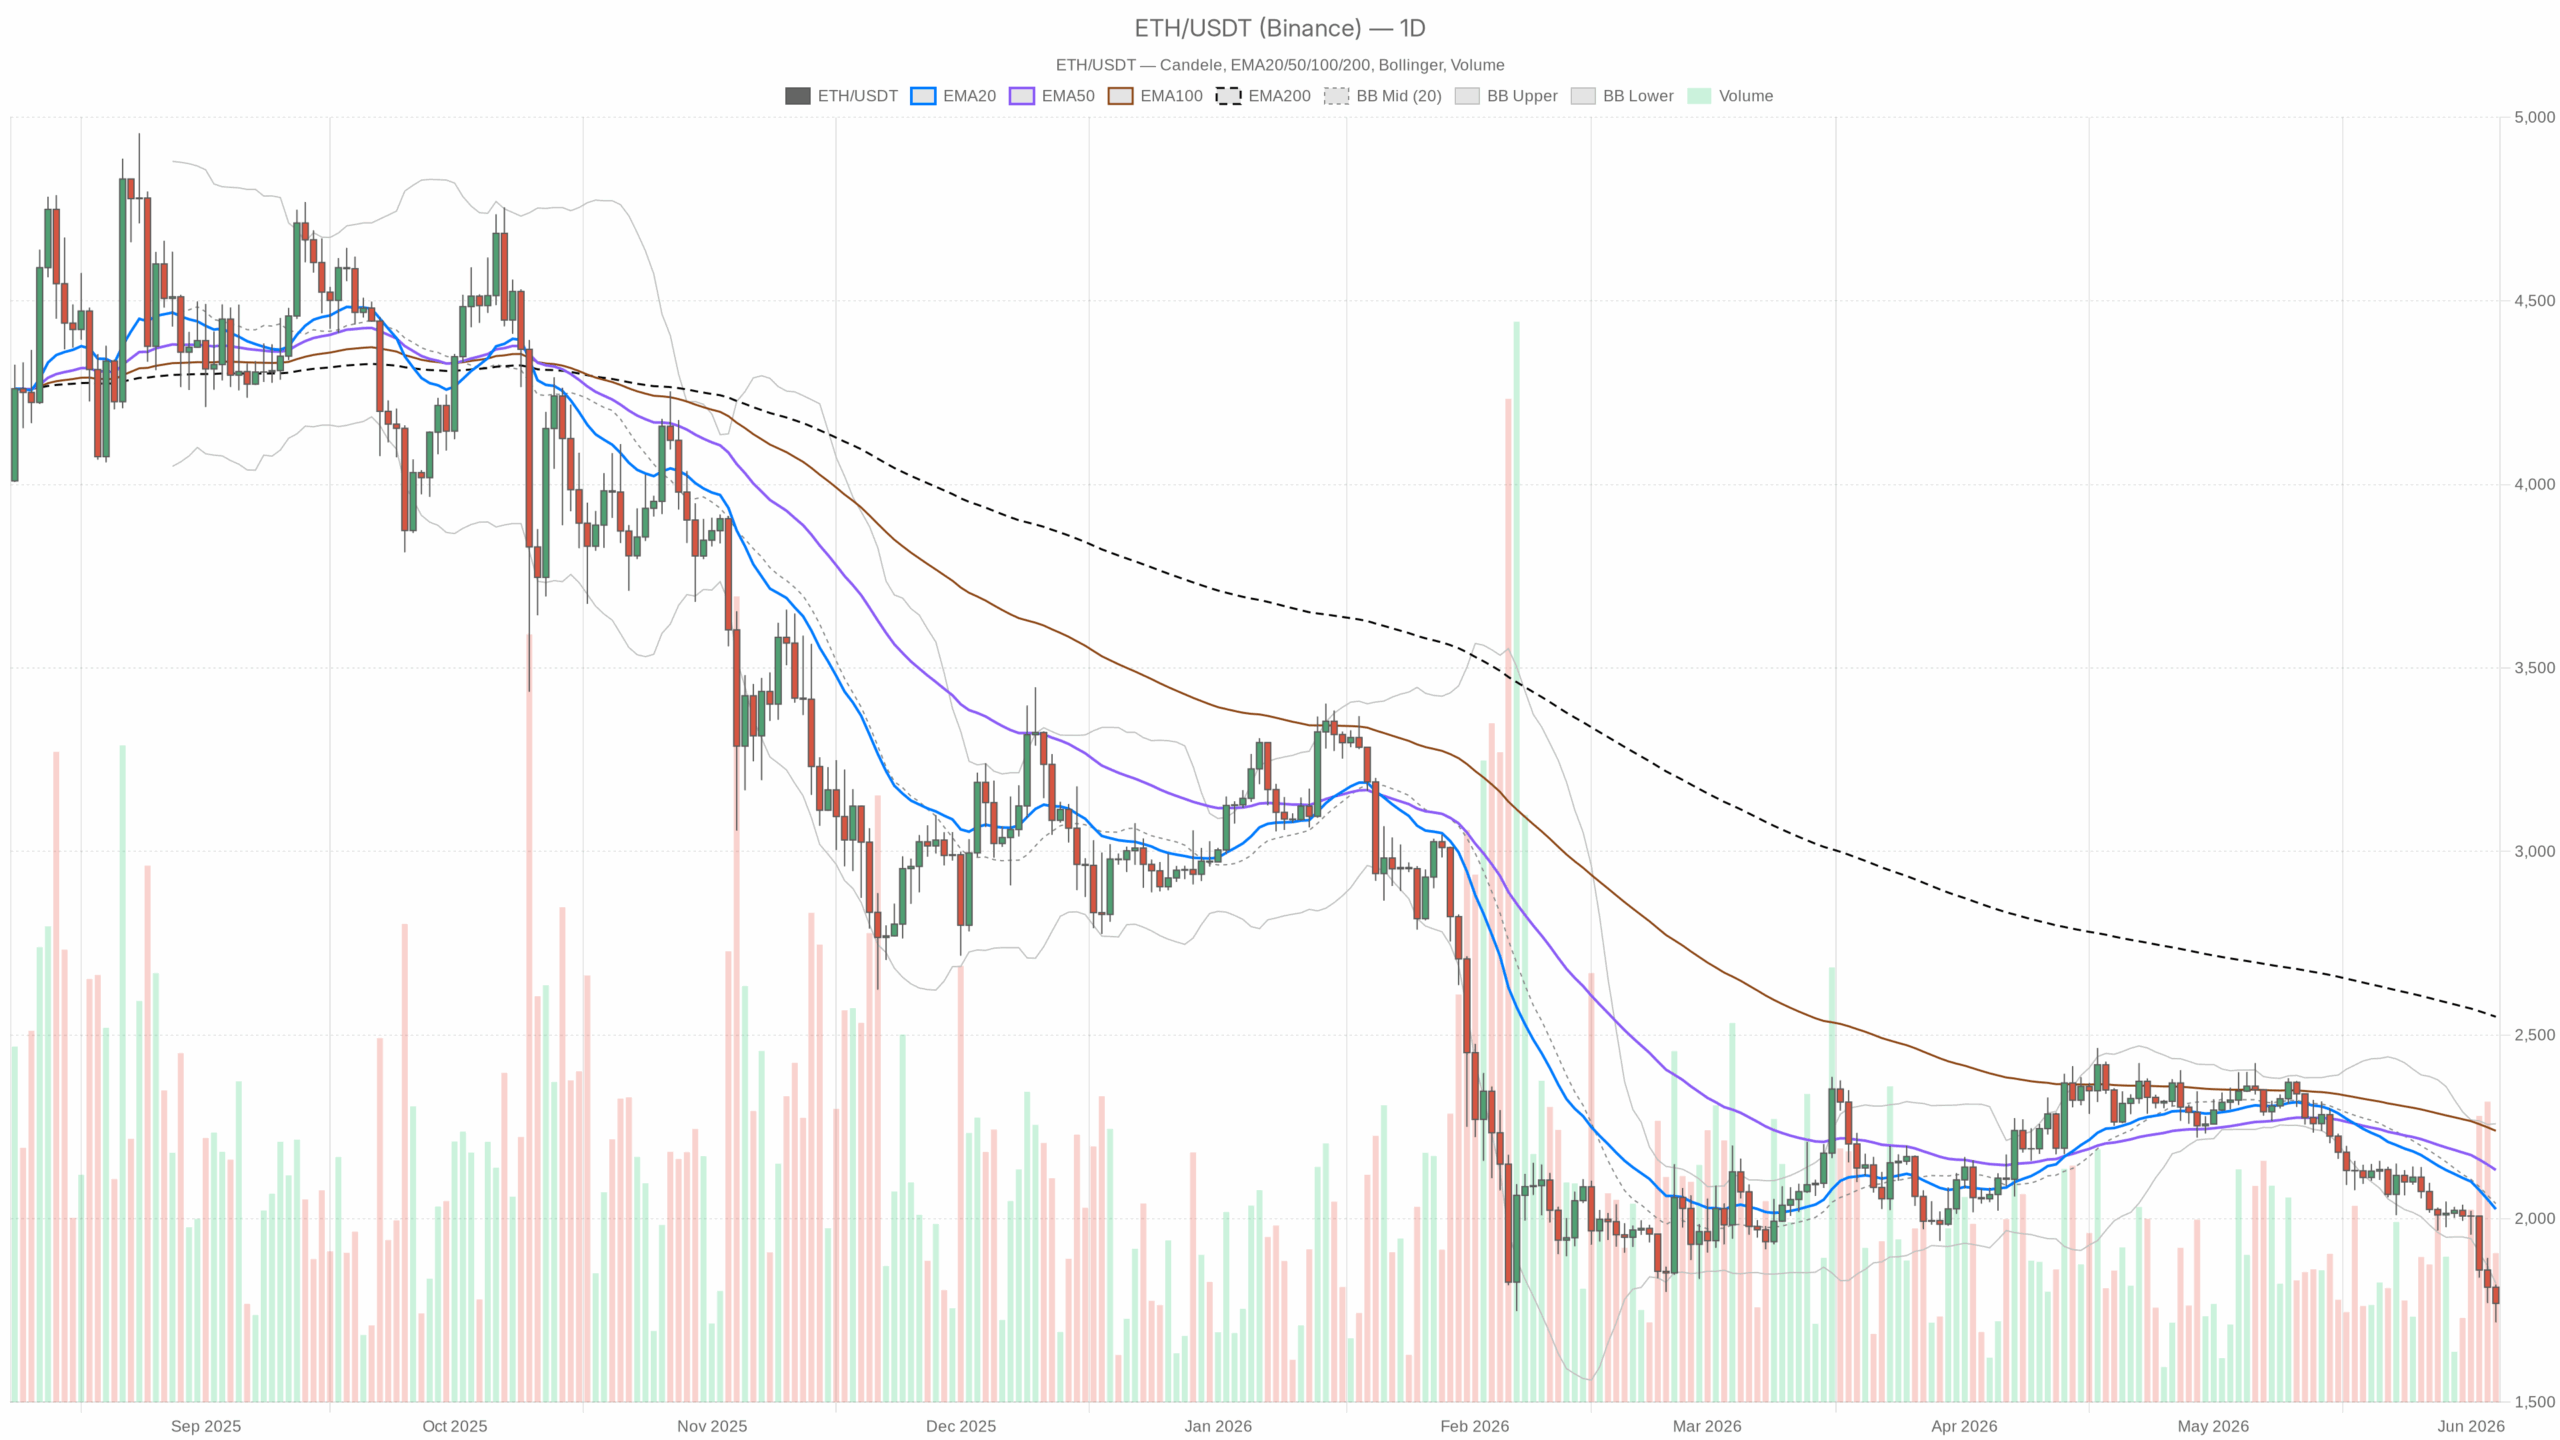 ETH/USDT — daily chart with candles, EMA20/EMA50 and volumes.
The daily structure says it all
On the daily timeframe, the picture is unequivocal. ETH is trading at $1,768.96, well below the EMA20 at $2,025, the EMA50 at $2,132 and the EMA200 at $2,549. Three exponential moving averages all sloping downward, perfectly aligned in a bearish configuration, with the price unable to even approach the shortest of them. Every recovery attempt dies before reaching the first dynamic resistance.
The Bollinger Bands on the daily show a lower band at $1,823 — and the price has already broken below that as well. When an asset breaks below the lower Bollinger Band on the daily, it is not just stretching: it is signaling selling pressure that exceeds statistically expected volatility. The middle band at $2,040 is now a distant ceiling, not a support.
The 14-period RSI on the daily is at 18.25. This is a number that must be emphasized: we are in extreme oversold territory, well beyond the classic 30 threshold. In theory, this should anticipate a technical rebound. In practice, an RSI this low in a strongly directional trend can remain compressed for weeks, continuing to fall while the price stabilizes or only briefly bounces. It is not an automatic buy signal — it is a warning that selling pressure has been violent and sustained.
The daily MACD tells the same story: line at -100.16, signal at -74.25, histogram at -25.91. The MACD line is still below the signal and the histogram remains negative, with no hint of a turn upward. There is no divergence, no weakening of bearish pressure on the daily. Momentum is still pointing downward.
The 14-period ATR is $84.08: an average daily volatility above $80, which in this context translates into sharp and hard-to-predict moves within a single session. Trading ETH intraday right now means accepting significant swings in very short periods of time.
The daily pivot levels indicate a main pivot at $1,768.91 — practically coinciding with the current price — a resistance R1 at $1,820.55 and a support S1 at $1,717.33. The fact that the price is exactly on the pivot is not neutral: it means that the market is in a phase of precarious balance, where any strong push in one direction can activate the next level.
The hourly and 15-minute charts confirm it, but with a nuance
On the 1-hour chart, ETH is at $1,764.68 with EMA20 at $1,808, EMA50 at $1,858 and EMA200 at $1,961. Here too, a compact bearish structure. The hourly RSI at 36.39 is not yet oversold, but it is clearly depressed and lacking momentum. The hourly MACD shows an interesting situation: line at -26.63 and signal at -26.39, with a histogram practically at zero (-0.24). This near-convergence between line and signal could indicate a temporary exhaustion of short-term bearish pressure — but it is not a reversal signal, at most it is a pause.
The hourly Bollinger Bands show a lower band at $1,746.89: the price is between the lower band and the middle band, in a compressed area. A classic context for a technical rebound, but in the absence of a catalyst the risk is to see sideways movement near the lows rather than a decisive recovery.
On the M15 the situation is similar: the price at $1,764.49 is trading slightly above the lower Bollinger Band ($1,764.16), with RSI at 37.53 and MACD still negative with a histogram at -2.42. The trading context does not offer clean setups: every rebound is sold before reaching significant resistances, and the short-term structure remains weak.
Bullish scenario: it exists, but requires solid confirmations
For a rebound to become credible, ETH should first recover and close steadily above $1,820-1,823 — the R1 resistance of the daily pivot almost exactly coincides with the lower Bollinger Band on the daily, creating a resistance cluster that the price would have to fully absorb. An hourly close above $1,820 with expanding volume would open the way towards $1,870-1,900, an area where the short-term EMAs on the 1-hour chart are concentrated.
This scenario is invalidated if the price remains below $1,820 in the coming hours and accelerates downward again. A daily RSI at 18 can bounce even without structure, but without confirmations of strength the rebound risks being a trap for hasty buyers.
Bearish scenario: the path of least resistance
The main trend is bearish on all three timeframes analyzed. The daily S1 support at $1,717.33 is the first natural target in case the move continues. Below that level, the technical structure does not offer significant supports until the $1,600-1,650 area, where older historical lows are located and where long-term buyers might step in.
This bearish scenario is invalidated only with a daily close above $1,870, a level that would bring the price back inside the daily Bollinger Bands and signal a change in pressure. Until then, every rebound should be treated as potentially sellable.
How to read this moment
The Ethereum price today is at a point of maximum pressure: daily RSI at the lows, price below all moving averages, Fear & Greed at 12. These are the markets in which the most experienced traders do not try to anticipate the bottom — they wait for it. An RSI at 18 does not mean that the price cannot fall further: it means that the speed of the decline has been abnormal and that the market is technically exhausted, but not necessarily ready to reverse.
The most concrete risk right now is the false rebound: an acceleration of a few percentage points towards $1,820-1,830 that attracts buyers, followed by a new bearish leg that pushes the price below $1,717. This pattern — rally in a downtrend, then break lower — is exactly what characterizes final capitulation phases, but also what produces the biggest losses for those who buy thinking it is the bottom.
Anyone trading ETH today must have one priority: risk management. The levels are there, the direction is clear, but the ATR volatility at $84 per day says that surprises — in both directions — are the order of the day.


You May Also Like

SanDisk (SNDK) Stock Soars 7% as Analysts Boost Price Targets to Record Levels

SanDisk (SNDK) Stock Jumps 7% to New All-Time High — And Wall Street Wants More

Fed expected to cut rates by 25 bps, Bitcoin and Ethereum steady


