

Solana (SOL) Price: SOL Just Lost a Critical Level and Analysts Say $53 Is Now in Play
TLDR
- SOL is trading around $69.53, down over 6% in 24 hours and more than 42% year-to-date.
- The critical $77 support level has been lost, with analyst Ali Martinez flagging $53 as the next major downside target.
- SOL is trading below all major moving averages (20, 50, 100, and 200-day EMAs), confirming a broad downtrend.
- DEX volumes on the Solana network have dropped 62% since January, falling from $111 billion to $42 billion monthly.
- A 5-month consolidation range between $77 and $97 has now broken down, pointing toward a possible move to $50.
Solana has extended its losses after breaking below a key support zone that many traders were watching closely. At the time of writing, SOL is trading at $69.53, with a 24-hour volume of $8.31 billion and a market cap of $40.22 billion.
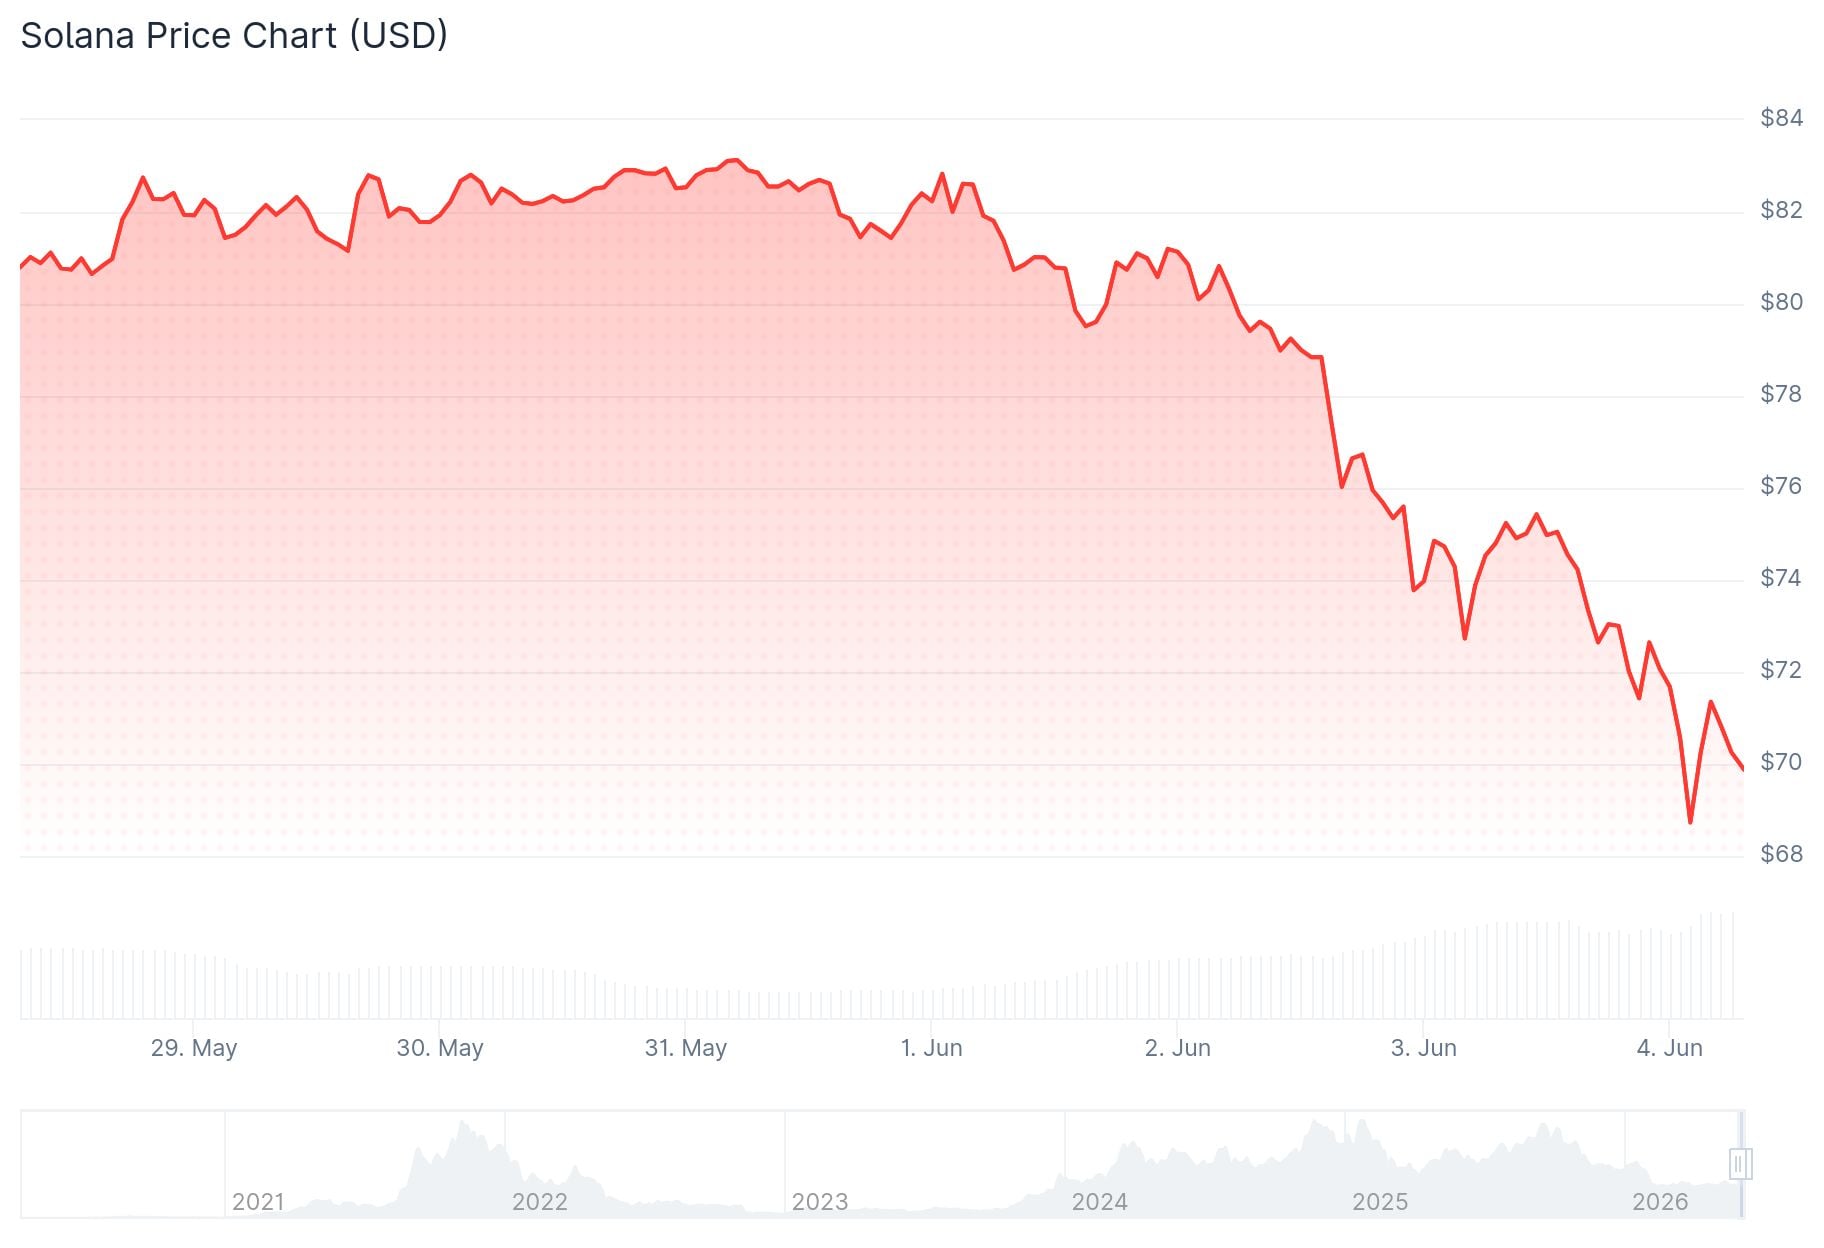 Solana (SOL) Price
The coin is down 6.45% in the past 24 hours and has shed more than 42% since the start of the year, making it one of the worst-performing large-cap cryptocurrencies in 2026.
Crypto analyst Ali Martinez flagged the $77 level as a critical support zone, based on data from the UTXO Realized Price Distribution (URPD) model. That level showed a high concentration of prior investor activity, meaning a lot of people bought SOL in that range.
With that zone now broken, Martinez noted there is not much demand below $77. He identified $53, $35, and $24 as the next areas of potential support.
The loss of a key level like $77 often increases volatility, as fewer buyers step in to absorb selling pressure.
Technical Indicators All Point Lower
SOL is currently trading below every major moving average. According to TradingView data, the 20-day EMA sits at $81.19, the 50-day at $84.44, the 100-day at $89.84, and the 200-day at $105.62.
This alignment across all timeframes confirms that the broader trend is firmly bearish. The MACD indicator adds to that picture, with the MACD line sitting below the signal line and expanding negative bars showing growing downside momentum.
Analyst Daan Crypto Trades also commented on the broader altcoin picture, noting that many coins are showing charts similar to SOL. He pointed to 4-month-plus ranges that have seen breakdowns or wicks below range lows. Daan said good setups would start forming once price reclaims those local ranges, with a potential play up to the range high or above.
The Relative Strength Index (RSI) on the weekly chart sits at 32, which is typically read as a bearish signal when it falls below 40.
Solana’s On-Chain Activity Has Declined
Solana’s decentralized exchange volumes have fallen 62% since January. At their peak, monthly DEX volumes on the network hit $111 billion. By last month, that figure had dropped to $42 billion.
 Source: DefiLlama
Transaction volumes on the network as a whole have also plateaued at around 700 million weekly after hitting a record of 959 million in early February.
Analysts have pointed to the slowdown in meme coin trading as a key factor. SOL’s blockchain built much of its recent activity around meme coin speculation, and as interest in that sector faded, so did the network metrics.
Solana broke below its 5-month consolidation range between $77 and $97 on the daily chart. Analysts say that kind of breakdown typically signals the continuation of the prior downtrend.
The next technical target to watch is $65. Holding that level could stabilize price action, but a break below it may open the door toward the $53 level identified by Martinez.
The post Solana (SOL) Price: SOL Just Lost a Critical Level and Analysts Say $53 Is Now in Play appeared first on CoinCentral.


You May Also Like

Solana Price Approaches $58 Support as $175 Target Remains

SanDisk (SNDK) Stock Soars 7% as Analysts Boost Price Targets to Record Levels

SanDisk (SNDK) Stock Jumps 7% to New All-Time High — And Wall Street Wants More


