Solana (SOL) Dips Modestly, But Traders Still Expect Bigger Move
Solana failed to stay above $96 and corrected some gains. SOL price is now consolidating and might aim for another increase above $98.
- SOL price started a downside correction below $96 against the US Dollar.
- The price is now trading above $94 and the 100-hourly simple moving average.
- There is a bullish trend line forming with support at $93.00 on the hourly chart of the SOL/USD pair (data source from Kraken).
- The pair could extend losses if it dips below the $92 zone.
Solana Price Remains Supported
Solana price failed to stay above $98 and started a downside correction, like Bitcoin and Ethereum. SOL dipped below $86 and $85 to enter a short-term bearish zone.
There was a move below the 23.6% Fib retracement level of the upward wave from the $87.61 swing low to the $98.47 high. The price even tested the $93.65 support. Besides, there is a bullish trend line forming with support at $93.00 on the hourly chart of the SOL/USD pair.
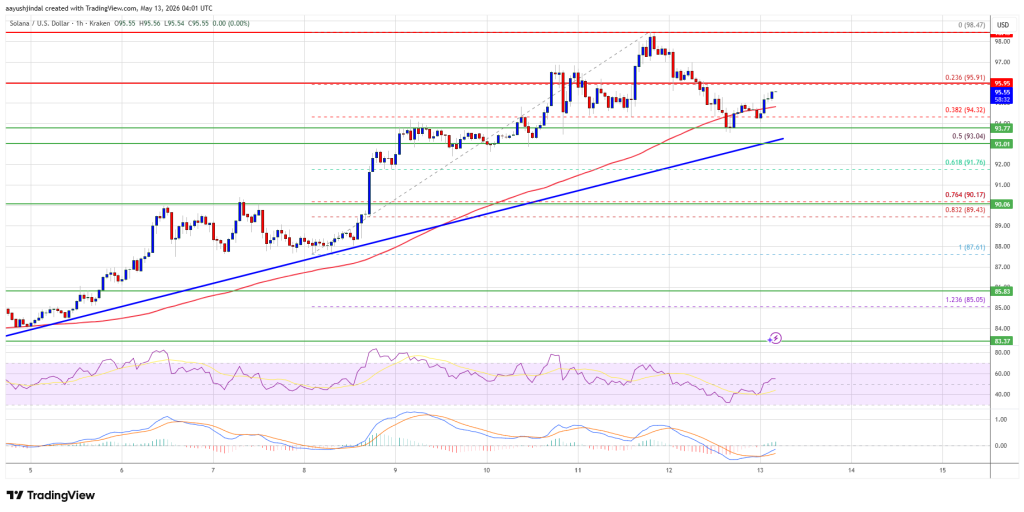
Solana is now trading above $94 and the 100-hourly simple moving average. On the upside, the price is facing resistance near the $96 level. The next major resistance is near the $98 level. The main resistance could be $102. A successful close above the $102 resistance zone could set the pace for another steady increase. The next key resistance is $105. Any more gains might send the price toward the $112 level.
Downside Break In SOL?
If SOL fails to rise above the $96 resistance, it could start another decline. Initial support on the downside is near the $94 zone, the trend line, and the 50% Fib retracement level of the upward wave from the $87.61 swing low to the $98.47 high. The first major support is near the $90 level.
A break below the $90 level might send the price toward the $88 support zone. If there is a close below the $88 support, the price could decline toward the $84 support in the near term.
Technical Indicators
Hourly MACD – The MACD for SOL/USD is gaining pace in the bullish zone.
Hourly Hours RSI (Relative Strength Index) – The RSI for SOL/USD is above the 50 level.
Major Support Levels – $94.00 and $90.00.
Major Resistance Levels – $96.00 and $98.00.


You May Also Like

Solana PreStocks Fall After Anthropic and OpenAI Alerts

MoneyGram Taps Stablecoins To Shield Colombians From Peso Weakness