

How to Use Drawing Tools (Original K-Line)

Website
App
Popular Articles
View More
The US-Iran Peace Deal Just Reset the Ethereum (ETH) Price Prediction, and the Numbers Back It Up
Peace changed the calculus for ETH, and not in the way most investors expected. When the US-Iran ceasefire was confirmed in June 2026, Ethereum did not simply recover alongside the broader market. It

ETH/BTC Ratio: What It Means, How It Moves, and Why It Matters
The ETH/BTC ratio is one of the most closely watched numbers in crypto — and for good reason. It tells you, at a glance, whether Ethereum is gaining ground on Bitcoin or falling behind, without ever

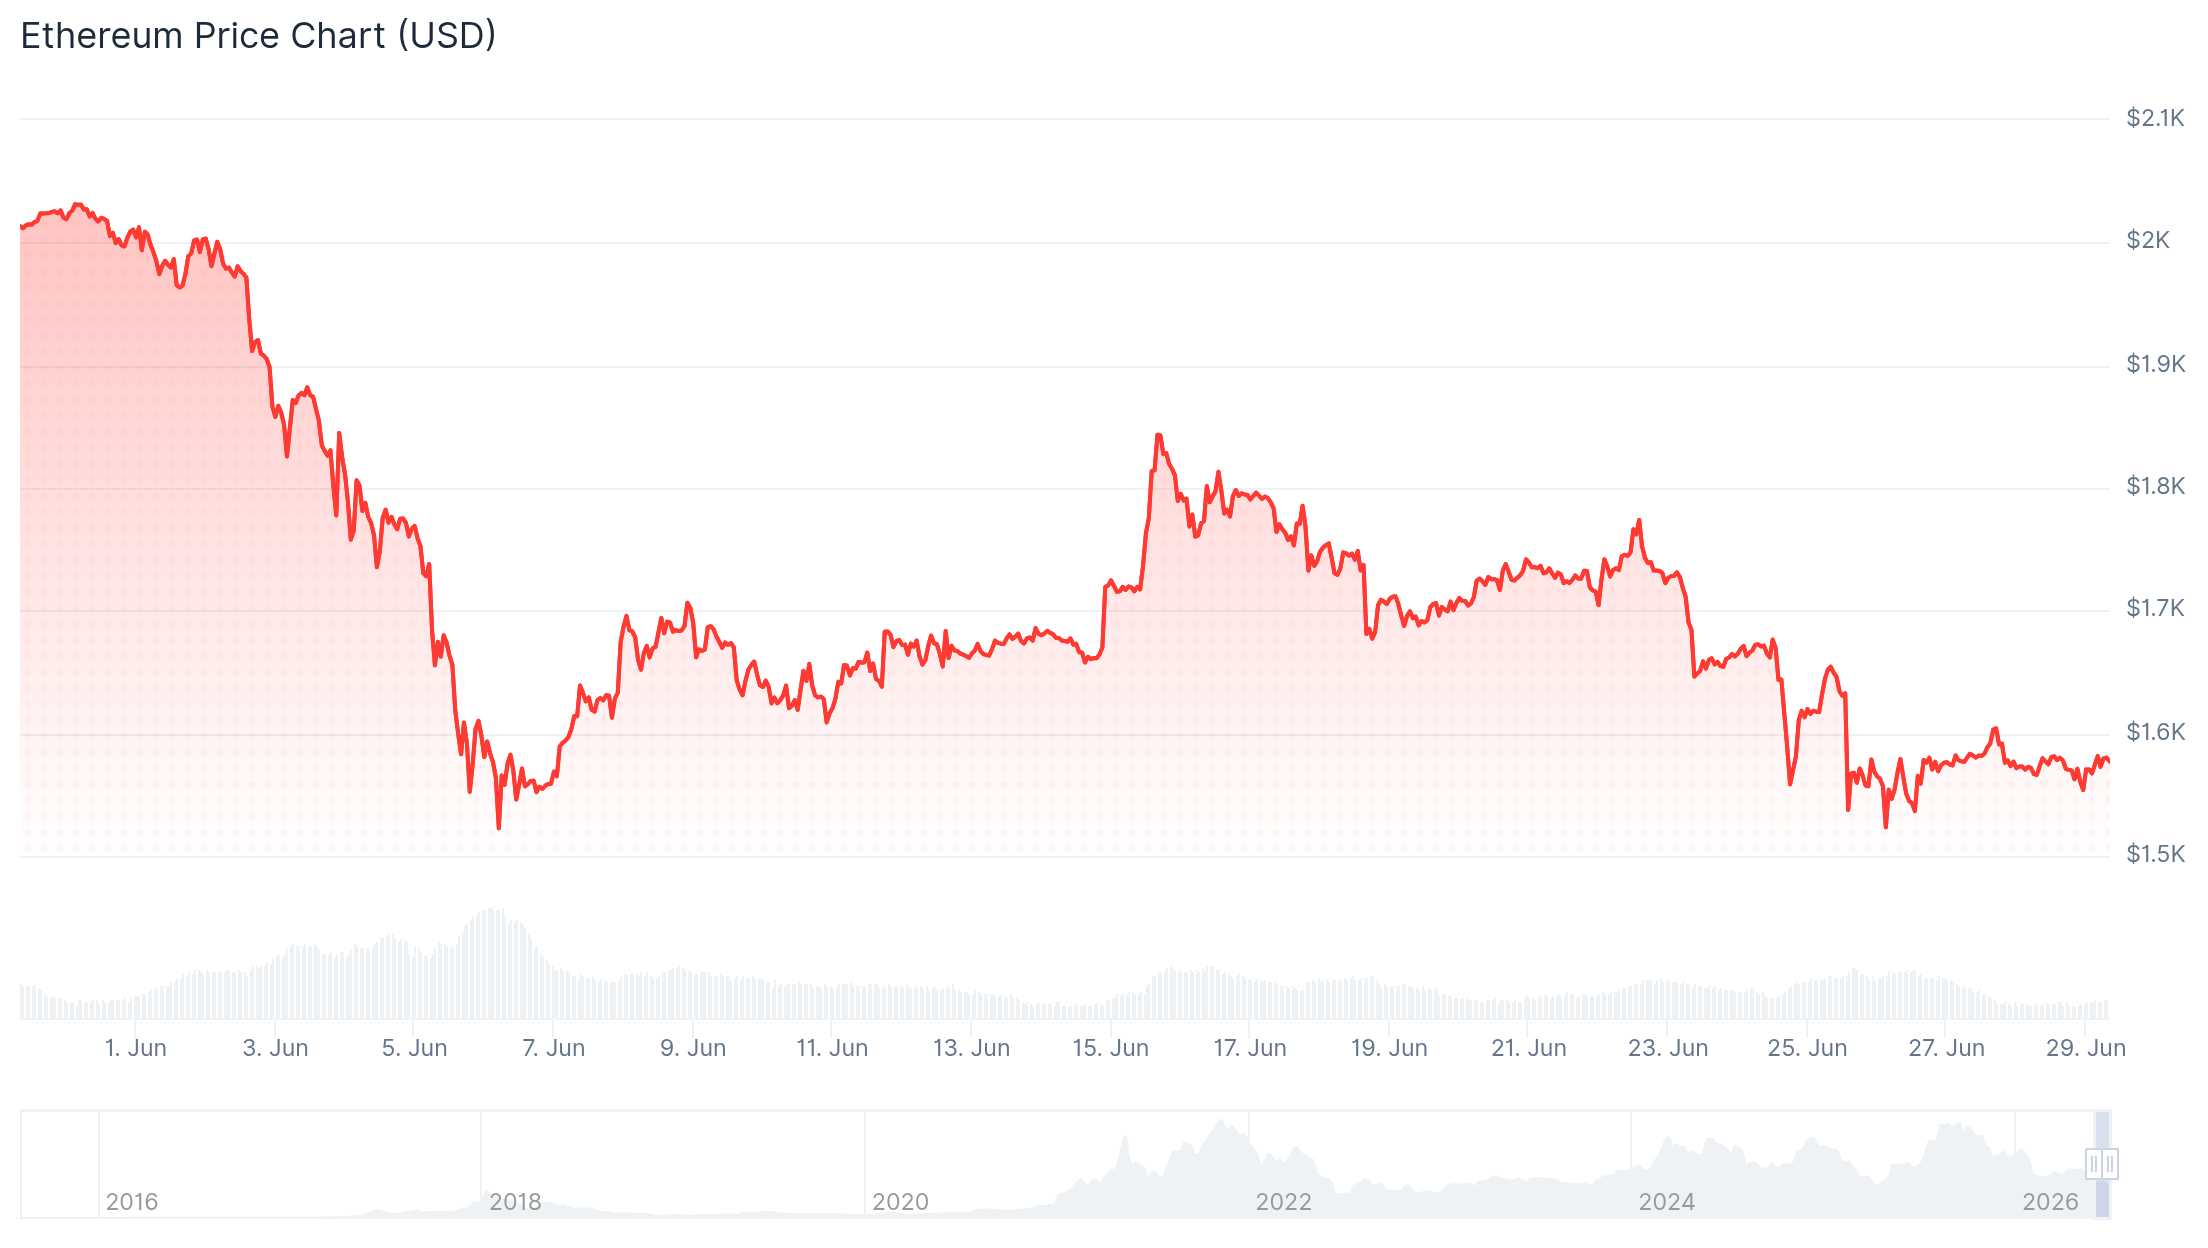
Will Ethereum Price Recover After a 60% Drop? ETH Price Prediction for June 2026
ETH opened June 2026 near $1,975, down approximately 60% from the all-time high of approximately $4,954 it reached in August 2025. The slide covers nine consecutive months of pressure: persistent ETF

Hot Crypto Updates
View More
Ethlabs Launches Former Ethereum Foundation Researchers Establish New Organization to Drive Institutional Adoption on Ethereum
Ethereum has witnessed the emergence of a new independent research organization called Ethlabs, founded by five former senior researchers from the Ethereum Foundation. Backed by major industry

Market Bleeds, Whales Buy: Inside the $10.7B Ethereum Empire Betting Big on H2 2026
Overview While 338 out of 390 major crypto tokens are in the red, one NYSE-listed company has been quietly building the largest Ethereum treasury in history. Bitmine Immersion Technologies (NYSE:

Ethereum Foundation Hits Reset: Vitalik Reveals Leaner EF, Less ETH Selling, and a CROPS-First Strategy
Vitalik Buterin announces the Ethereum Foundation will "slim down," reduce ETH sales, and refocus exclusively on CROPS — censorship resistance, openness, privacy, and security. Here's what it means

Trending News
View More
SharpLink Buys $62.4M in Ethereum
SharpLink Revives Ethereum Buying Strategy With $62.4 Million ETH Acquisition SharpLink has made a significant return to the Ethereum market, purchasing approxi
Sharplink ETH Buying Spree Hits $62.4M After Long Pause Ends
TLDR; Sharplink ETH purchases reached $62.4 million after an eight-month pause, signaling renewed corporate Ether demand. Arkham data shows Sharplink added 39,196


Related Articles
View More
How to Use TradingView on MEXC
TradingView is a powerful trading analysis tool that caters to users of all experience levels. MEXC has integrated TradingView's charting tools, allowing you to use them directly on the MEXC platform.

Analysis of Common Technical Indicators in the Cryptocurrency Market
In crypto trading, technical indicator analysis refers to a quantitative method that uses mathematical and statistical formulas to assess market trends. By processing price and volume data through spe

What Is the Stochastic Indicator (KDJ)?
The Stochastic Indicator (KDJ) is a technical analysis tool that analyzes price trends to assess market strength and identify overbought and oversold conditions, helping traders make buy and sell deci


