

How to Quickly Draw Price Lines and High/Low Price Lines
1. What is the Price Line and High–Low Price Line?
1.1 What is the Price Line?
1.2 What is the High–Low Price Line?
2. How to Read the Price Line and the High–Low Price Line?
3. Three Key Benefits of the Price Line and High–Low Price Line
4. How to Quickly Draw Price Lines and High–Low Price Lines on MEXC
5. Mastering Basic Analysis Tools to Improve Trading Performance
Recommended Reading:
- Why Choose MEXC Futures? Gain deeper insight into the advantages and unique features of MEXC Futures to help you stay ahead in the market.
- MEXC Futures Trading Tutorial (App) Understand the full process of trading Futures on the app and get started with ease.
Popular Articles
View More
The Ethereum Foundation Just Cut Its Budget by 40%: What Does That Mean for ETH's Price? Here's The Ethereum Price Prediction for July 2026
Ethereum opened July 2026 trading near $1,571, a fraction of the roughly $4,950 all-time high it set less than a year earlier. That drop has a lot of people typing the same question into Google in
U.S. Stock Weekly Report | June 22–26: Three Rate Hikes Test Market Resilience as AI Hardware Supercycle Comes Into Question
This week, U.S. equities experienced a textbook case of a "rate shock + sector rotation" market structure. A rate hike projection report from Bank of America (BofA) triggered a sharp sell-off in

XRP Price Analysis: Can XRP Hold Support After the Pullback?
XRP is trading near a key short-term zone after losing momentum over the past week. As of June 29, 2026, the MEXC XRP price page shows XRP near $1.04, down around 0.88% over 24 hours and roughly

Hot Crypto Updates
View More
Is ANSEM Legit? What Traders Need to Know
Overview ANSEM, also known as The Black Bull, has become one of the most discussed Solana meme coins in recent days. Its momentum has been driven by crypto influencer Ansem, community speculation,

Trump Made Over $1 Billion From Crypto While the Industry Slumped: What It Reveals About Crypto’s New Profit Model
While much of the cryptocurrency market spent the past year grappling with declining prices and weaker investor sentiment, one of the industry’s most surprising success stories came from an unlikely

Bitcoin ETF Outflows Explained: Why Institutions Are Selling (And Retail Isn't)
Overview June 2026 delivered the worst monthly outflow in spot Bitcoin ETF history: 4.06 billion dollars exited US funds, surpassing the previous record of 3.56 billion dollars set in February 2025.

Trending News
View More
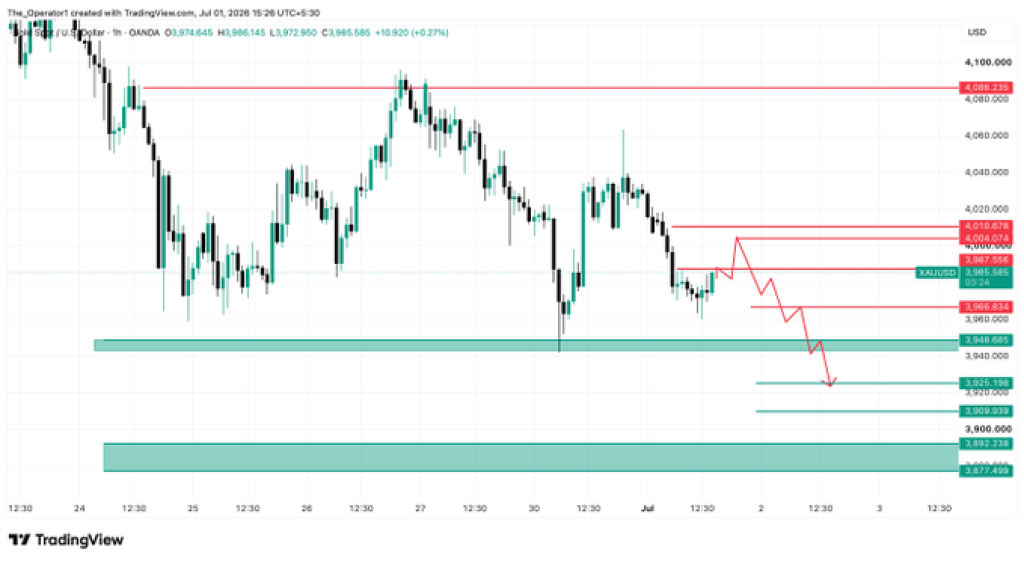
Gold Holds Above $4,000 as Markets Brace for Fed Chair Warsh’s Keynote Speech
BitcoinWorld Gold Holds Above $4,000 as Markets Brace for Fed Chair Warsh’s Keynote Speech Gold prices steadied above the psychologically significant $4,000 per

AAVE Network Growth Hits 4-Year High as New Wallet Creation Surges 1,806 in a Day
AAVE just recorded 1,806 new wallets in a day, its highest network growth since October 2021, signaling fresh demand behind the recent 23% price surge.

Related Articles
View More
What Is MEXC Earn?
1. What is MEXC Earn?MEXC Earn is a one-stop product launched by MEXC to help users discover a variety of token-holding earning opportunities. It covers flexible savings, fixed savings, and on-chain e

How to Deposit Crypto to MEXC App: MetaMask & Wallet Transfer Guide
If you have crypto in other wallets or platforms, you can choose to transfer them to the MEXC platform for trading.How to Deposit Crypto to the MEXC PlatformStep 1: Open the MEXC App on your mobile ph

How to Deposit Crypto to the MEXC Platform (Website)
If you have crypto in other wallets or platforms, you can choose to transfer them to the MEXC platform for trading.How to Deposit Crypto to the MEXC PlatformStep 1: Open your browser and log in to the


