

Crude Oil Futures Chart: How to Read the Energy Market
If you want to trade global energy, the crude oil futures chart is your most important tool. It is not just a picture of past prices. It is a live map of human psychology, supply, and demand.
Many beginners look at a trading chart and feel confused by the green and red bars. In this guide, I will explain exactly how to read a crude oil futures chart. I will also show you how to spot macro trends and execute trades using MEXC.
The Anatomy of a Candlestick
Most professional traders use a "candlestick" chart (or K-line chart) to track oil prices. Each candlestick shows you the price action for a specific time period, like one hour or one day.
Every single candlestick gives you four critical pieces of data, known as OHLC:
Open: The price when the time period started.
High: The highest price reached during that time.
Low: The lowest price dropped to during that time.
Close: The final price when the time period ended.
If the Close is higher than the Open, the candlestick is green (Bullish). Buyers won the battle. If the Close is lower than the Open, the candlestick is red (Bearish). Sellers pushed the price down.
WTI vs. Brent on the Chart
When you open an exchange, you will see different charts for different types of oil. You must choose the right chart for your strategy.
If you are trading US economic data, you should open the WTI chart. If you are trading Middle East news, you should open the Brent chart. To understand why these two charts move slightly differently during a crisis, read our guide on the difference between WTI and Brent.
Interactive Chart Reading Simulator
The best way to understand a crude oil futures chart is to interact with one. Use the educational simulator below to see how candlesticks form. You can trigger different macro events to see how the chart reacts in real time.
Hover over the candles to read the exact Open, High, Low, and Close data.
Why 24/7 Chart Access Matters
Traditional commodity markets close on Friday evening. They do not open again until Monday morning. This creates a massive problem.
If a war starts on Saturday, the oil price will gap up massively. Traditional traders cannot see this on their charts or protect their money until Monday. By then, it is too late.
This is why modern traders use synthetic derivatives. If you want to know how this works behind the scenes, read what are crypto crude oil futures. Because crypto exchanges never sleep, your WTI and Brent charts update 24 hours a day, 7 days a week. You can see the price action the exact second a news story breaks.
Execute Your Strategy on MEXC
Once you know how to read the chart, it is time to trade. If you are ready to learn how to trade crude oil with USDT, MEXC provides the ultimate platform.
Here is why you should trade oil on MEXC:
0% Trading Fees: Every time a candlestick closes, you can enter or exit a trade without paying high broker commissions.
200x Leverage: You can use a small amount of capital to catch big profits from minor chart breakouts.
Deep Liquidity: MEXC offers institutional-grade order books. This means your market orders execute instantly, exactly where you see the price on the chart.
Do not trade blindly. Learn the chart, manage your risk, and trade the global energy market with confidence. Log in to MEXC, open the USOIL or UKOIL chart, and start catching the next big macro trend today.
Popular Articles
View More
DJT Stock: Is Trump Media a Turnaround Trade or a Political Meme Stock?
DJT stock is one of the strangest names in the U.S. equity market. Trump Media & Technology Group, the company behind Truth Social, trades like a media company, a political proxy, a meme stock, a

F Stock: Is Ford Becoming an AI Power Trade or Still a Truck Cycle Story?
Ford Motor Company has spent years being treated like an old-economy automaker: cyclical, capital-heavy, dividend-sensitive, and closely tied to U.S. truck demand. That view is not wrong, but it may
NuScale Power (SMR): Is the Nuclear AI Power Trade Still Early?
Key Takeaways NuScale Power is a U.S. small modular reactor company trading under the ticker SMR. The bull case is tied to AI data-center power demand, nuclear policy support, and NuScale’s

Hot Crypto Updates
View More
Who Is Ansem? The Solana Trader Behind The Black Bull ($ANSEM)
Who is Ansem? Discover the real identity of Solana's most influential crypto trader, how he built his reputation, and what you need to know about the $ANSEM (The Black Bull) memecoin that exploded

Is Solana Memecoin Season Back? What On-Chain Data Reveals
Is Solana Memecoin Season back? Pump.fun DEX volume hit a record $2B in a single day, on-chain wallets surged, and the Solana meme market cap climbed 31% in weeks. Here is what the data actually

What Is Ansem? Why Did $ANSEM Explode — And What Comes Next?
What is Ansem, and why did $ANSEM explode 17,000%+ in June 2026? A deep-dive into the Solana influencer's background, the Black Bull memecoin surge, the airdrop catalyst, and the real risks behind

Trending News
View More
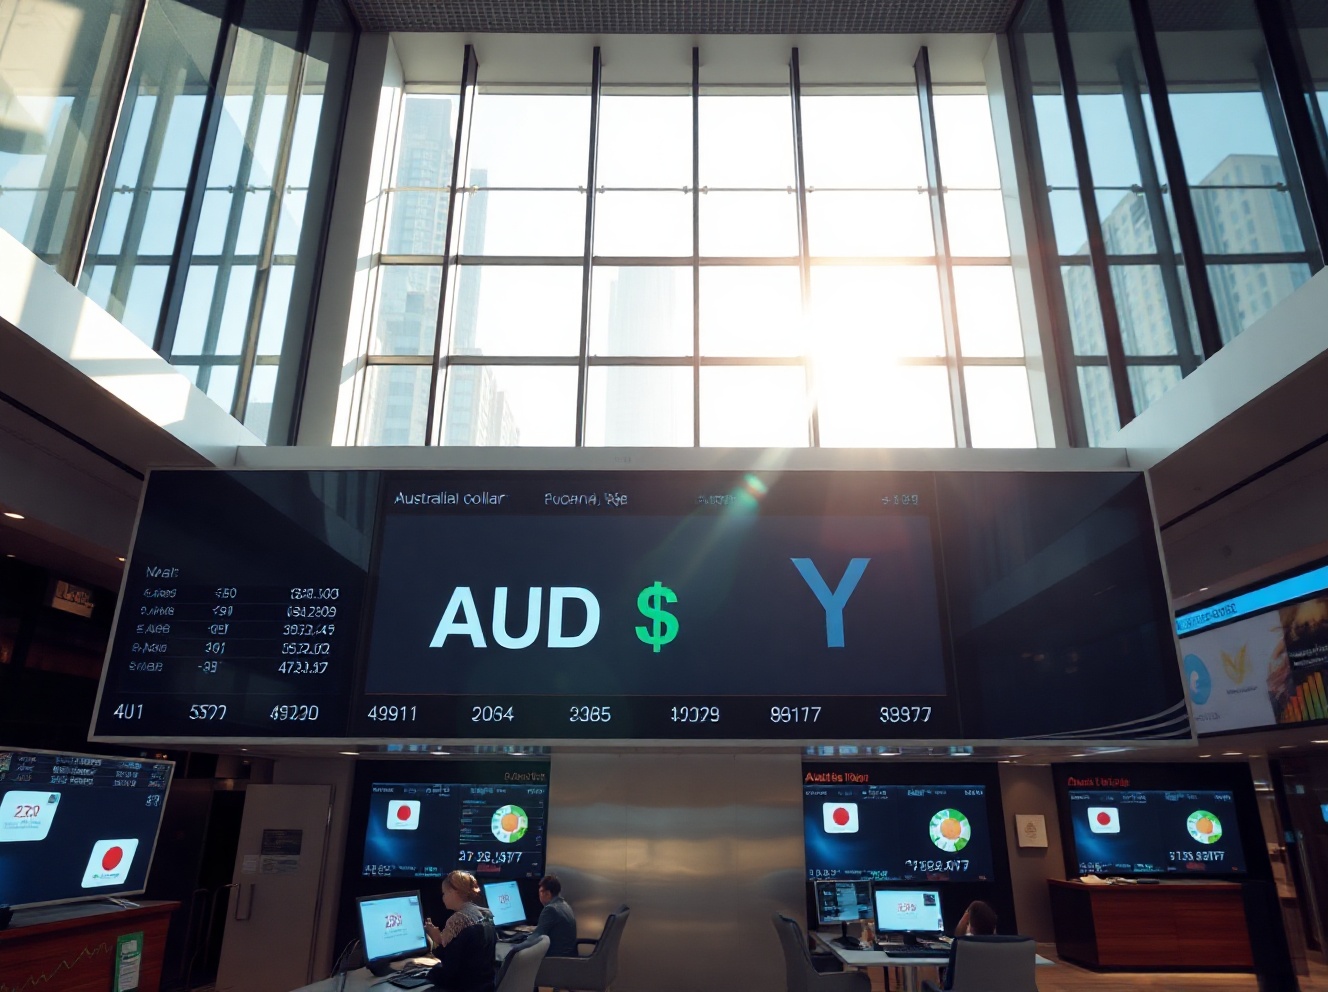
Australian Dollar Holds Steady After Trade Balance Data Release
BitcoinWorld Australian Dollar Holds Steady After Trade Balance Data Release The Australian Dollar (AUD) traded in a narrow range on Thursday, stabilizing after

Belgian deputy PM Prevot begins first Malaysia visit with focus on clean energy and trade
SEPANG, July 2 — Belgium’s Deputy Prime Minister and Minister of Foreign Affairs, European Affairs and Devel...

Related Articles
View More
Open USD Stablecoin (OUSD): Why the New Stablecoin Alliance Matters
Open USD Stablecoin, also referred to as OUSD, has quickly become one of the most important stablecoin stories of 2026. Unlike many new digital assets that begin inside a small crypto-native community
DJT Stock: Is Trump Media a Turnaround Trade or a Political Meme Stock?
DJT stock is one of the strangest names in the U.S. equity market. Trump Media & Technology Group, the company behind Truth Social, trades like a media company, a political proxy, a meme stock, a cryp

Trump Meme Coin: What Traders Should Know About TRUMP, Politics, and Meme-Coin Risk
Trump meme coin is not a normal crypto asset. It is part meme coin, part political brand, part speculative trading vehicle, and part controversy. Since its launch in January 2025, TRUMP has become one


