

BTC Liquidation Heatmap: What It Is and How to Use It
- A BTC liquidation heatmap is a color-coded visual tool that maps where clusters of leveraged Bitcoin positions are estimated to be force-closed.
- Yellow zones indicate high liquidation density and often act as price magnets, while dark or blue zones signal low concentration.
- Zones above the current BTC price reveal at-risk long positions; zones below reveal at-risk short positions.
- Traders use the heatmap to set smarter stop-losses, identify likely price targets, and anticipate liquidation cascades.
- The heatmap works best as one layer in a broader strategy — always combine it with indicators like RSI, funding rate, and open interest for confirmation.
- CoinGlass and CoinAnk both offer free, real-time BTC liquidation heatmap access with no account required.
What Is a BTC Liquidation Heatmap?
How to Read the BTC Liquidation Heatmap
Where to Find a Live BTC Liquidation Heatmap
How Traders Use the BTC Heatmap to Make Decisions
Using Yellow Zones as Price Targets
Setting Stop-Losses Around Major Clusters
Anticipating Liquidation Cascades
Combining the Heatmap with Other Indicators
Matching Timeframe to Your Trading Style
FAQ
Conclusion
Popular Articles
View More
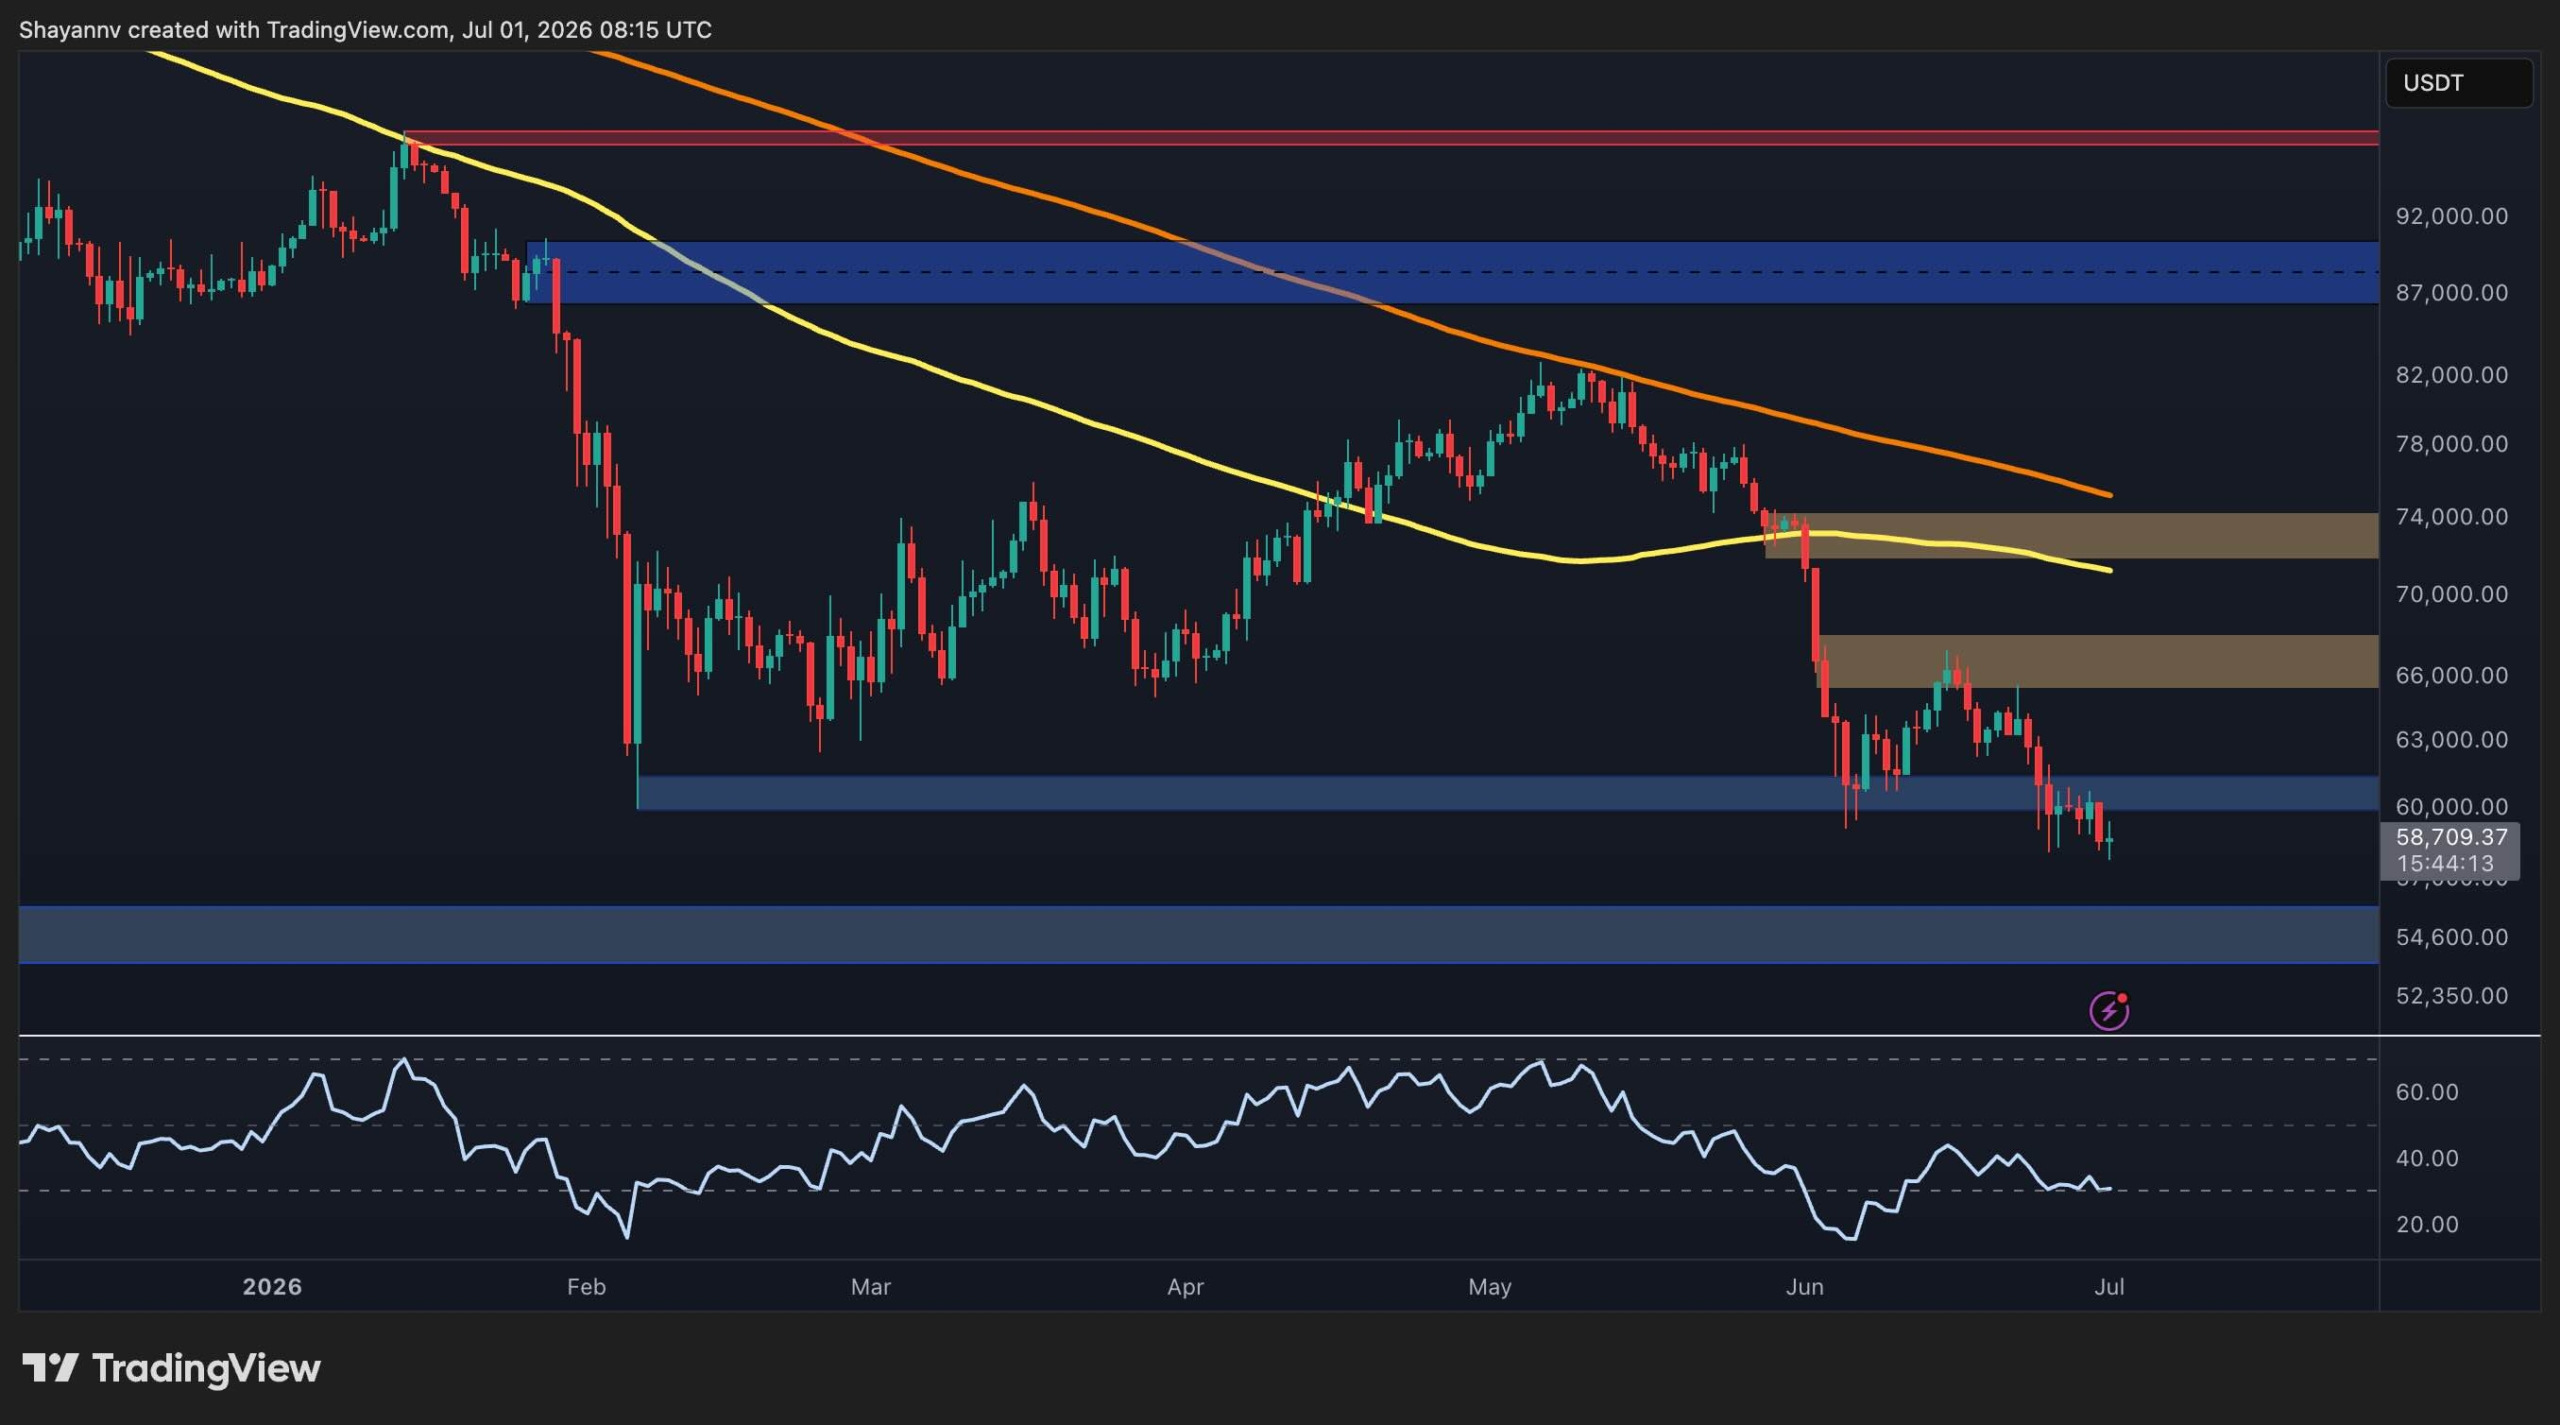
Bitcoin (BTC) Price Prediction July 2026: Can BTC Still Hit $100K After Crashing Below $60,000?
Bitcoin just closed out one of its toughest stretches of 2026, falling roughly 30 percent through the first half of the year and landing on track for its second straight quarterly loss, only the

Could Bitcoin Fall to $54,000? Inside the $10.6B BTC Options Gamma Trap
More than $10.6 billion in Bitcoin options are settling today, and the market is not where bulls expected it to be. Traders who spent months positioning for BTC above $80,000 are watching those

What If Stock Dividends Built Your Bitcoin Position Automatically? The Franklin Templeton Bitcoin DRIP ETF Explained
Wall Street has just filed for an automatic Bitcoin buyer, and if approved, it would run on dividends. In June 2026, Franklin Templeton, an asset manager overseeing more than $1.5 trillion in assets

MEXC Alpha Trader Research Weekly | ETF Net Outflows Persist as BTC's $62K "Iron Floor" Holds Firm—Who Is Quietly Accumulating Amid Extreme Fear?
Week 3 of June 2026 Statistical Round: June 17, 2026 – June 23 Data Cutoff: June 23, 2026 Core Narrative Over the past week, the crypto market experienced sharp volatility under the dual pressure of
Hot Crypto Updates
View More
BTC Just Broke $60K Again - And Prediction Markets Are Bracing for Worse
Overview Bitcoin fell below the $60,000 mark again in June 2026, briefly touching the $59,100 to $60,200 range and hitting its lowest level since late 2024. This is not an isolated dip. Over the

Bitcoin Nears $58,000 on Kalshi: Is the ETF Bleed Dragging Bulls to Their Knees?
Overview Bitcoin (BTC) has been under sustained pressure throughout June 2026, trading below $63,000 and sitting more than 50% below its October 2025 all-time high of $126,198. On the regulated U.S.

Strategy Bought the Dip Below Its Own Cost Basis — and Triggered a $504M Short Squeeze
Strategy bought 1,550 BTC at $65,332 — below its own average cost for the first time. Bitcoin rebounded above $63,000 and wiped out $504 million in short positions in 24 hours. Here's what actually

Trending News
View More
Metaplanet Reports No New Share Issuance for Bitcoin Purchases in June
BitcoinWorld Metaplanet Reports No New Share Issuance for Bitcoin Purchases in June Japanese investment firm Metaplanet, known for its strategic Bitcoin (BTC)

CryptoQuant CEO Ju said over $1 trillion in new institutional capital is needed for a sustained Bitcoin recovery
🚨 CryptoQuant CEO says $1 trillion in new capital is needed to revive $BTC’s price. 💸 Institutional funds are still flowing into AI stocks, not Bitcoin, as outflows
Related Articles
View MoreWhat If Stock Dividends Built Your Bitcoin Position Automatically? The Franklin Templeton Bitcoin DRIP ETF Explained
Wall Street has just filed for an automatic Bitcoin buyer, and if approved, it would run on dividends.In June 2026, Franklin Templeton, an asset manager overseeing more than $1.5 trillion in assets gl

Bitcoin Bank: What It Is and How to Move Money Between BTC and Your Bank
Bitcoin and banks used to feel like opposites.One was built to bypass the financial system — the other is the financial system.But that divide is closing fast, and if you own Bitcoin or plan to buy so

What Is Bitcoin Trader? What the Scam Warnings and Reviews Really Say
You've probably seen the name Bitcoin Trader pop up in an ad, a forum thread, or maybe a suspicious celebrity endorsement.Before you click anything, it's worth knowing exactly what this platform is —


