Amazon Stock Faces 5% Drop Risk If $236 Support Breaks
Amazon stock faces bearish daily pressure heading into July. AMZN closed June 30 at $238.34 — below both key moving averages. Despite strong long-term fundamentals, short-term momentum remains soft. The stock must clear critical resistance to shift the bias.
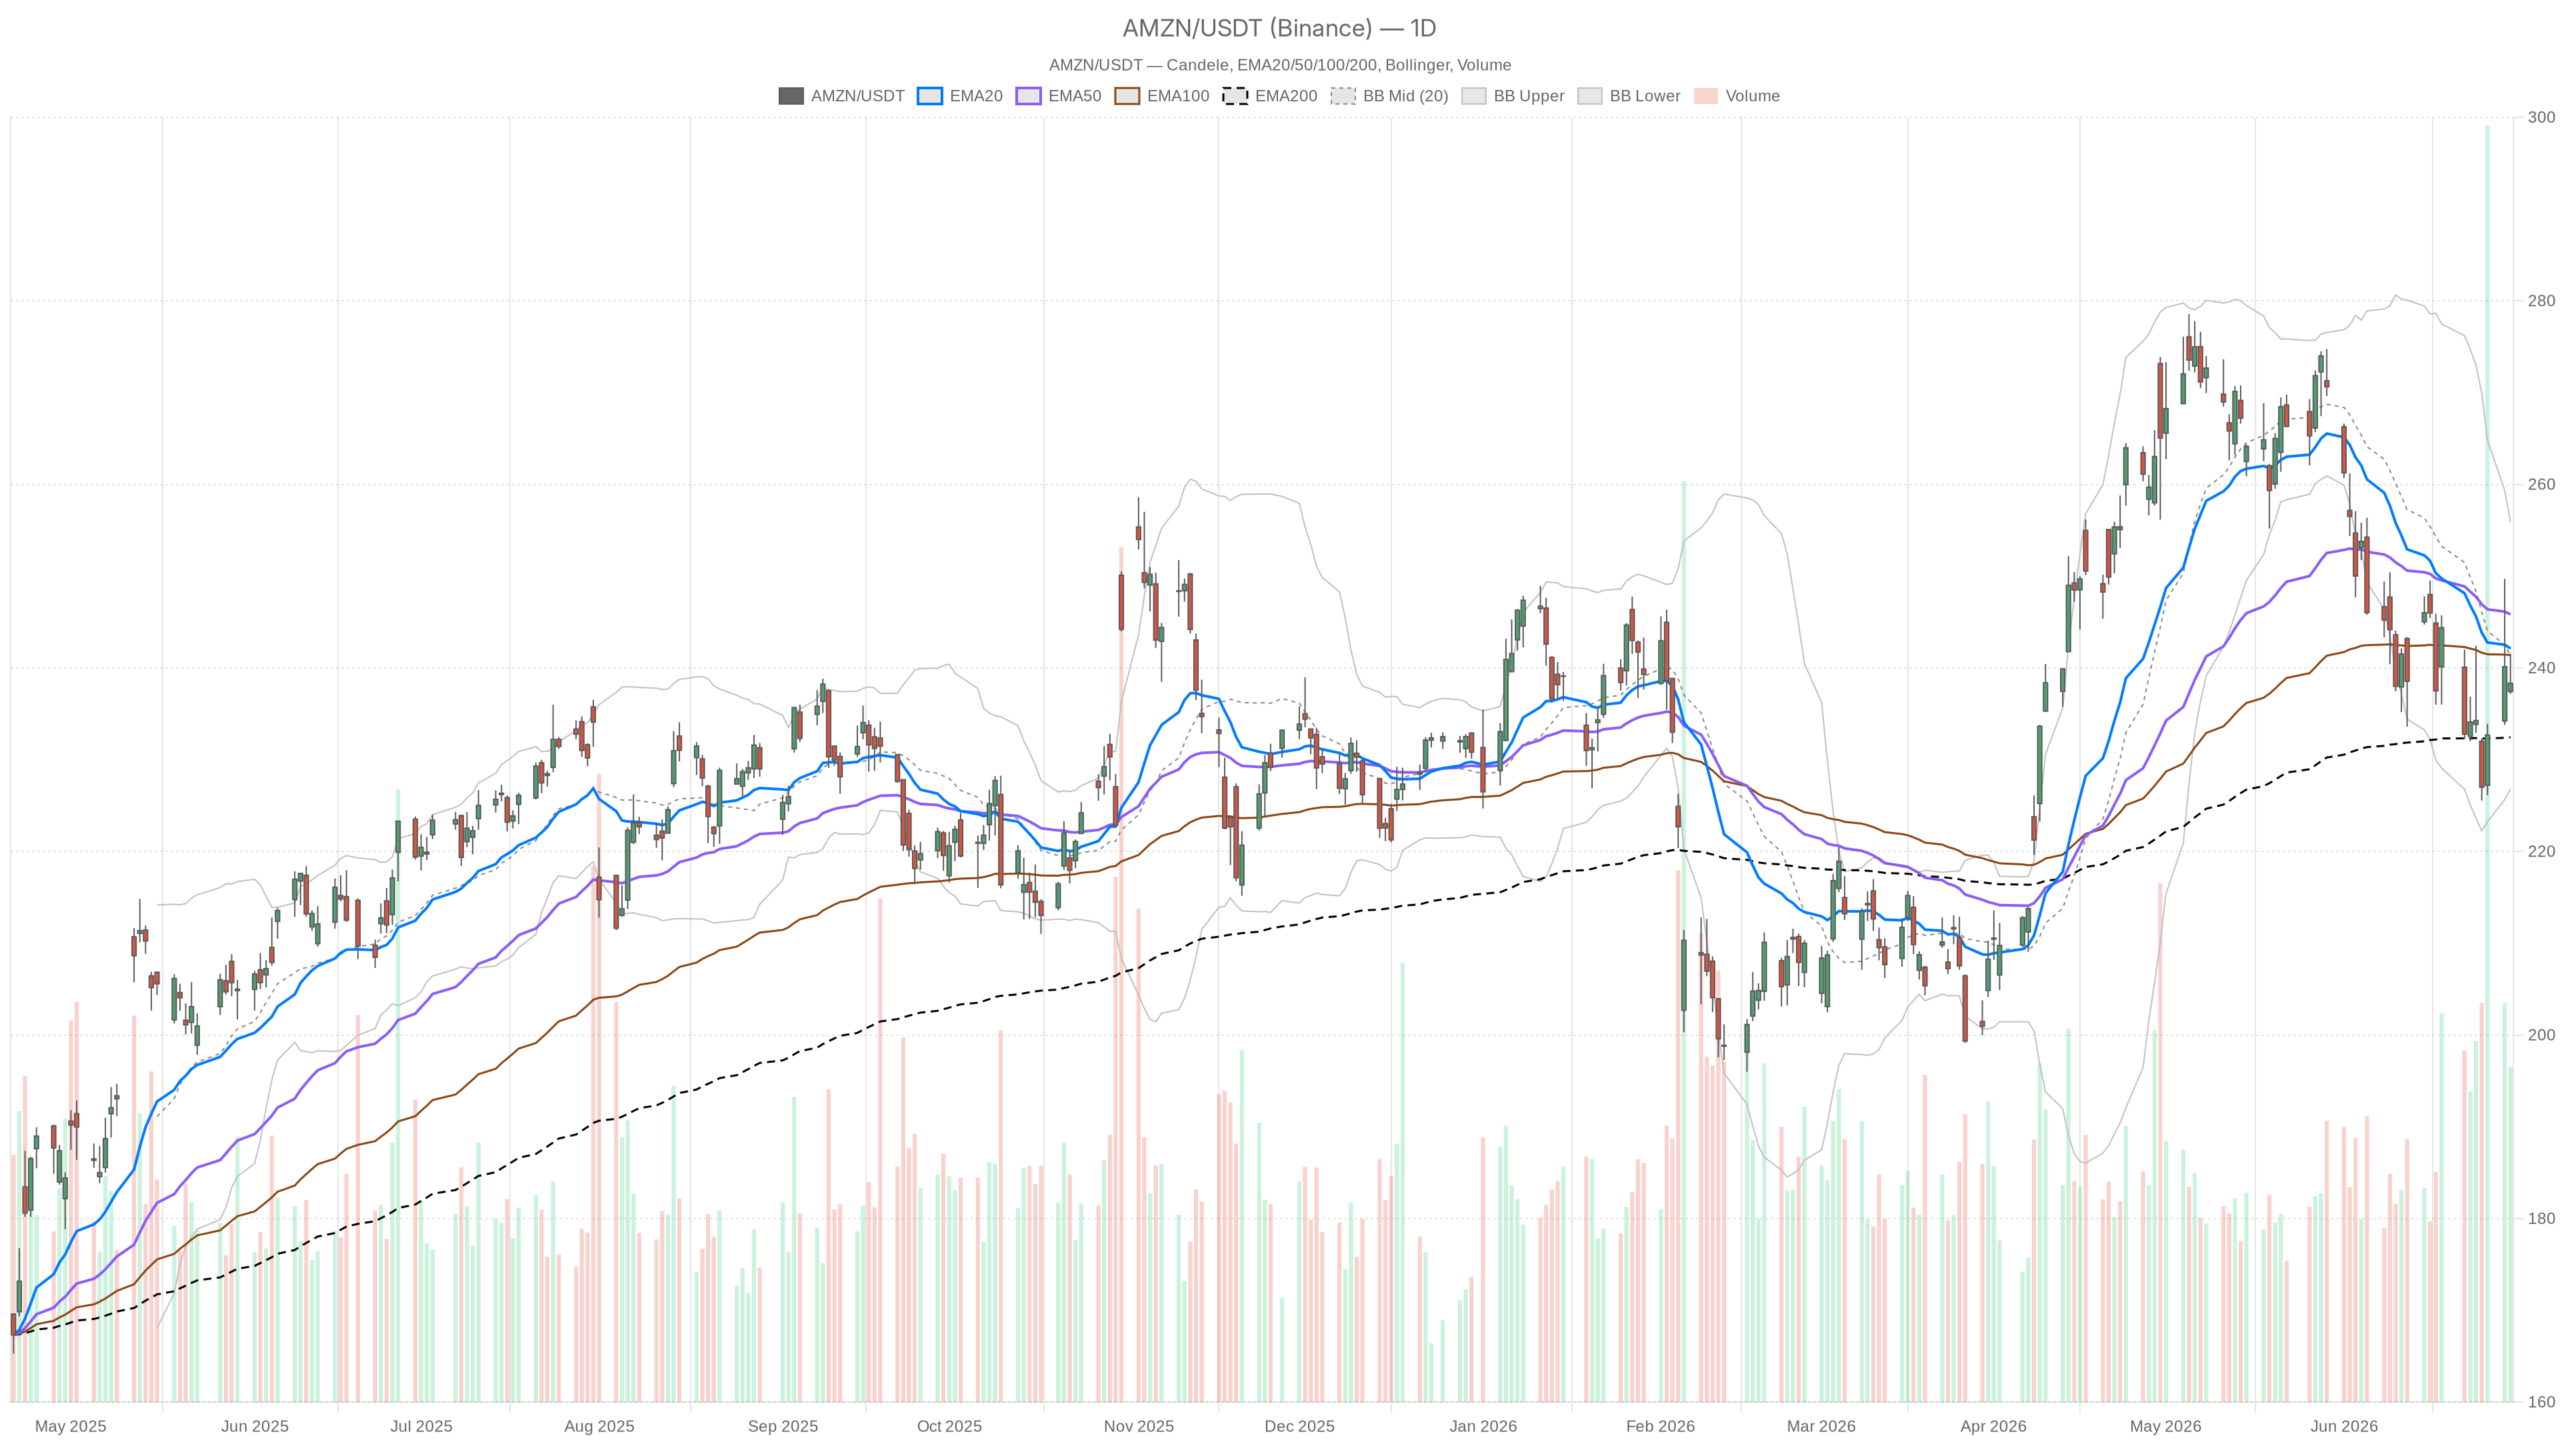 AMZN — daily chart with candlesticks, EMA20/EMA50 and volume.
Key takeaways
- AMZN closed June 30 at $238.34, beneath the daily EMA20 ($242.13) and EMA50 ($245.83).
- Daily RSI at 44.91 and a negative MACD histogram confirm bearish momentum remains intact.
- The hourly chart shows tentative stabilization above intraday moving averages near the $237–$238 zone.
- A break below daily S1 at $236.49 would accelerate selling pressure toward the Bollinger lower band at $226.80.
- Long-term fundamentals stay compelling, driven by AWS AI expansion and a potential $1 trillion revenue thesis by 2028.
Amazon Stock Daily Chart: Bearish Bias Dominates
Amazon stock’s daily chart presents a clearly bearish bias. Price sits below both key moving averages, and momentum indicators continue to point lower. The close at $238.34 places AMZN beneath the EMA20 at $242.13 and the EMA50 at $245.83. Both averages are sloping downward relative to current price. This confirms the stock remains in a corrective phase off its recent highs.
The only structural trend support comes from the daily EMA200 at $232.45. That level serves as a long-term floor and remains well below current price. As long as AMZN holds above it, the broader uptrend structure is not technically broken. However, the distance between price and that support leaves room for further downside before any structural damage registers.
Momentum and Structure Signals
The daily RSI reads 44.91 — drifting below the neutral 50 level without reaching oversold territory. Sellers remain in control. However, a capitulation flush has not yet occurred. That leaves open the possibility of either a slow grind lower or a sudden volatility spike that resets the indicator.
Meanwhile, the daily MACD reinforces the cautious view. The MACD line sits at -5.75 against a signal of -5.65, producing a histogram of -0.10. The negative histogram is marginally widening. That signals a continuation of bearish momentum, not a reversal setup. The signal is weak in magnitude but consistent in direction.
Bollinger Bands and Pivot Levels
Bollinger Bands show the stock trading in the lower half of the range. The midline at $241.35 acts as overhead resistance. The lower band at $226.80 provides structural support on the downside — roughly 5% below current levels. Meanwhile, the upper band at $255.90 remains far from reach. Daily ATR at $8.63 reflects elevated volatility, meaning any directional move could cover several percentage points quickly.
The daily pivot analysis places the pivot point at $239.02, with R1 at $240.86 and S1 at $236.49. AMZN closed below its daily pivot. That is a mild but consistent bearish signal for short-term traders. The S1 level aligns closely with the lower boundary of recent intraday consolidation, making it a critical line in the sand.
AMZN Hourly Timeframe: Short-Term Stabilization
The hourly chart provides a tentative counterbalance to the daily bearishness. Price has stabilized above near-term intraday moving averages after finding support near $237. On the 1H frame, AMZN closed at $238.25 — above both the EMA20 at $237.67 and the EMA50 at $237.20. That short-term structure is mildly constructive. The stock held above near-term intraday support and regained some ground from the session lows.
Notably, the 1H RSI at 52.72 sits just above the 50 midline. The reading suggests neutral-to-slightly-bullish short-term momentum. It is not a strong signal, but it is not deteriorating either. The 1H MACD line stands at 1.29 against a signal of 1.28, producing a near-flat positive histogram. The crossover is barely there. Still, on this timeframe, the momentum pendulum has at least stopped swinging lower — a direct contrast to the daily MACD.
Recovery Meets Overhead Resistance
However, the 1H EMA200 sits at $246.50 — well above current price. This longer-term moving average represents serious overhead resistance. A rally toward $246–$247 would face real supply before making structural progress. The Bollinger midline on the 1H sits at $237.29, with the upper band at $246.49 aligning precisely with that EMA200 resistance zone. The convergence is not coincidental.
The 1H pivot sits at $238.44, with R1 at $239.34 and S1 at $237.35. AMZN is essentially hugging the pivot zone — indecisive, tight, and waiting for direction. Until price breaks decisively above R1 or below S1, the hourly chart offers no actionable bias.
15-Minute Frame: Execution Context
The 15-minute chart reflects tight consolidation, offering no clear directional signal for the near term. Price closed at $238.25, slightly below the EMA20 at $238.87 and roughly in line with the EMA50 at $238.42. The 15m RSI at 45.63 leans mildly negative. The MACD sits in negative histogram territory, with the line at -0.26. Short-term sellers held the edge heading into the close.
The 15m ATR of $0.93 reflects tight intraday ranges with no immediate volatility expansion. Bollinger Bands are compressing, with price near the lower half of a tight range. A break below $237.26 or above $240.69 would deliver the first clear short-term directional signal. Until then, the 15-minute chart is purely an execution lens — not a bias-setting timeframe.
Bullish Scenario: Key Levels to Reclaim
A bullish reversal for Amazon stock requires reclaiming the daily EMA20 at $242 with conviction. A close above that level would signal the corrective phase is losing steam and that buyers are stepping in ahead of fundamental catalysts. The Prime Day promotional cycle in July could generate positive sentiment and drive volume into the stock.
Additionally, the daily EMA200 at $232.45 remains intact. As long as AMZN holds above that level, the long-term structure is not broken. A bounce from the $236–$237 zone — near the daily S1 and the 1H lower pivot region — could serve as a higher-low setup if momentum confirms. Reclaiming the EMA50 near $245–$246 would mark a genuine intermediate trend shift.
On the fundamental side, Bank of America’s Buy reiteration and the broader AWS narrative give institutional investors reason to accumulate on weakness. The $1 trillion revenue thesis by 2028 and the $1 billion AI engineering unit are structural catalysts. AWS pricing power is a recurring margin driver, not a speculative story. If those themes begin to price in more aggressively, the stock has room to recover lost ground.
Bearish Scenario: Support Levels Under Threat
The bearish case tightens if AMZN fails to reclaim $239–$240 and breaks below daily S1 at $236.49. A daily close beneath that level would accelerate selling pressure. Below it, the next technical reference is the Bollinger lower band at $226.80 — roughly 5% lower from current levels.
The daily MACD remains negative and shows no sign of reversing. If the histogram continues to widen negatively, the stock could drift lower without needing a specific bearish catalyst. At the same time, valuation concerns around freight costs and premium multiples could weigh on sentiment if macro conditions tighten further.
Overall, the 1H EMA200 at $246.50 also serves as a ceiling for any recovery attempt. Without breaking that level, even a short-term rally remains trapped inside a broader corrective structure. The primary risk is that a failed rally from current levels triggers a deeper flush toward the $230–$232 range, where stronger structural support awaits.
Conclusion: Navigating Compression and Conflict
Amazon stock presents a structurally complex picture heading into July. The daily timeframe defines the main bias as cautiously bearish — price below key moving averages, soft momentum, and a MACD still in negative territory. However, the hourly chart shows the selloff has paused near the $236–$237 zone. That zone is the immediate battleground.
A hold there keeps the near-term bounce scenario alive. A break below shifts focus to deeper daily support near $226.80. Traders with shorter horizons should respect the intraday pivot structure and the 15m compression before committing to directional exposure. For longer-term investors, the fundamental story remains compelling — but price structure needs to confirm before the bull thesis fully reasserts itself. Volatility remains elevated, with a daily ATR near $8.60, meaning moves can be sharp and fast in either direction.
FAQ
Is Amazon stock bearish or bullish right now?
The daily chart shows a bearish bias, with AMZN below both its 20-day and 50-day EMAs and the daily RSI at 44.91. However, the hourly chart displays tentative stabilization, creating a mixed near-term outlook that lacks a definitive directional signal.
What are the key support levels for Amazon stock?
Immediate support sits at the $236–$237 zone, aligning with the daily S1 pivot and the lower boundary of recent intraday consolidation. Below that, the daily EMA200 at $232.45 and the Bollinger lower band at $226.80 represent the next structural supports.
What needs to happen for AMZN to turn bullish again?
A daily close above the EMA20 at $242 would be the first bullish signal. Reclaiming the EMA50 near $245–$246 and the 1H EMA200 at $246.50 would confirm a genuine shift in the intermediate trend. Without clearing these levels, any rally remains corrective.
Does Amazon’s long-term fundamental outlook support higher prices?
Yes. Analysts see a potential path to $1 trillion in annual revenue by 2028. AWS’s $1 billion AI engineering unit is driving enterprise adoption, and Bank of America reiterated its Buy rating citing AWS pricing power. These are structural positives that could support long-term price appreciation once technical conditions align.
Disclaimer: This article is for informational purposes only and does not constitute financial advice, an investment recommendation, or a solicitation to buy or sell any financial instrument or cryptocurrency. The analysis provided is not indicative of future results. Investing in crypto assets and financial markets carries a high risk of capital loss. Always do your own research (DYOR) and consult a qualified financial advisor before making any decision.
Article produced with the assistance of artificial intelligence and reviewed by the editorial team.


You May Also Like

Trump fesses up as reporter accuses him of 'profiting off presidency'

MemeCore Price Prediction: Can M Extend Its 45% Rally?