CVS Health Stock Is Up 77% From Its 52-Week Low. Here’s What the Zepbound Decision Means for 2027
Key Stats for CVS Stock
- Past week’s performance: +1.7%
- 52-week range:$59 to $106
- Valuation model target price: $142
- Implied upside: 36.1% over the next 2.5 years
Value your favorite stocks like CVS with 5 years of analysts’ forecasts using TIKR’s new Valuation Model (It’s free) >>>
A Landmark Q1, a Policy Reversal on Zepbound, and the Managed-Care Comeback
CVS Health Corporation (CVS) has staged a remarkable recovery since its 52-week low near $59. The stock sits around $104, roughly 77% above that trough, and the catalysts behind the move are fundamentally operational rather than speculative. The pivot started with the Q1 2026 earnings report on May 6.
 CVS Adjusted EPS (TIKR)
CVS reported Q1 revenue of $100.4 billion, well above the consensus estimate of $95.1 billion. Adjusted EPS came in at $2.57 versus the estimated $2.20. Improving medical cost controls in the Aetna managed-care division primarily drove the beat.
The medical cost ratio improved more than expected. CVS raised its full-year 2026 revenue outlook to at least $405 billion following the strong quarter. On the earnings call, management noted that final 2027 Medicare Advantage rates remain insufficient, but that near-term performance was tracking ahead of plan.
Then came the Zepbound decision. CVS Caremark reinstated coverage for Eli Lilly’s obesity drug Zepbound, adding it to commercial formularies as an additional preferred option effective October 1. Formulary decisions are the mechanism PBMs use to determine which drugs employer-sponsored insurance plans cover. Removing Zepbound from formularies earlier had been controversial.
The reversal signals that CVS Caremark is actively managing the obesity drug pipeline rather than ceding ground to competitors like Express Scripts or OptumRx. Aetna also launched a second-generation AI claims platform that cut processing time by over 20%, reducing the administrative friction that had contributed to prior-year margin compression.
Going forward, investors will likely evaluate CVS stock based on whether medical cost trends continue to improve in Q2 and whether Aetna’s Medicare Advantage performance rebounds enough to make 2027 guidance more credible despite the challenging rate environment.
See analysts’ growth forecasts and price targets for CVS (It’s free) >>>
Is CVS Stock Still a Turnaround Value at $104?
 CVS Guided Valuation Model (TIKR)
Under valuation model assumptions realized through 12/31/28, the stock is modeled using:
- Revenue Growth (CAGR): 3.7%
- Operating Margins: 4.1%
- Exit P/E Multiple: 13.7x
Based on these inputs, the model estimates a target price of $142, implying 36.1% total upside from the current share price of $104 and an annualized return of 13% over the next 2.5 years.
A 13% annualized return from a company with a 3.7% revenue CAGR requires operating margin recovery, and that is exactly the bet embedded in this model. CVS’s LTM EBIT margin is currently 2.7%. The model projects a recovery to 4.1%, which is still well below the 6% CVS averaged before the Aetna cost crisis. So the model does not assume a full return to historical efficiency. It assumes partial normalization, which is a more defensible base case.
 CVS Guided Valuation Model (TIKR)
The 13.7x exit P/E is modest but appropriate for a healthcare conglomerate with thin net margins, significant debt, and ongoing regulatory scrutiny. CVS’s NTM P/E sits at 13.7x today, so the model effectively assumes no multiple expansion. All of the implied return, therefore, comes from earnings growth. That conservative framing makes the 36.1% total return compelling if the operating assumptions hold.
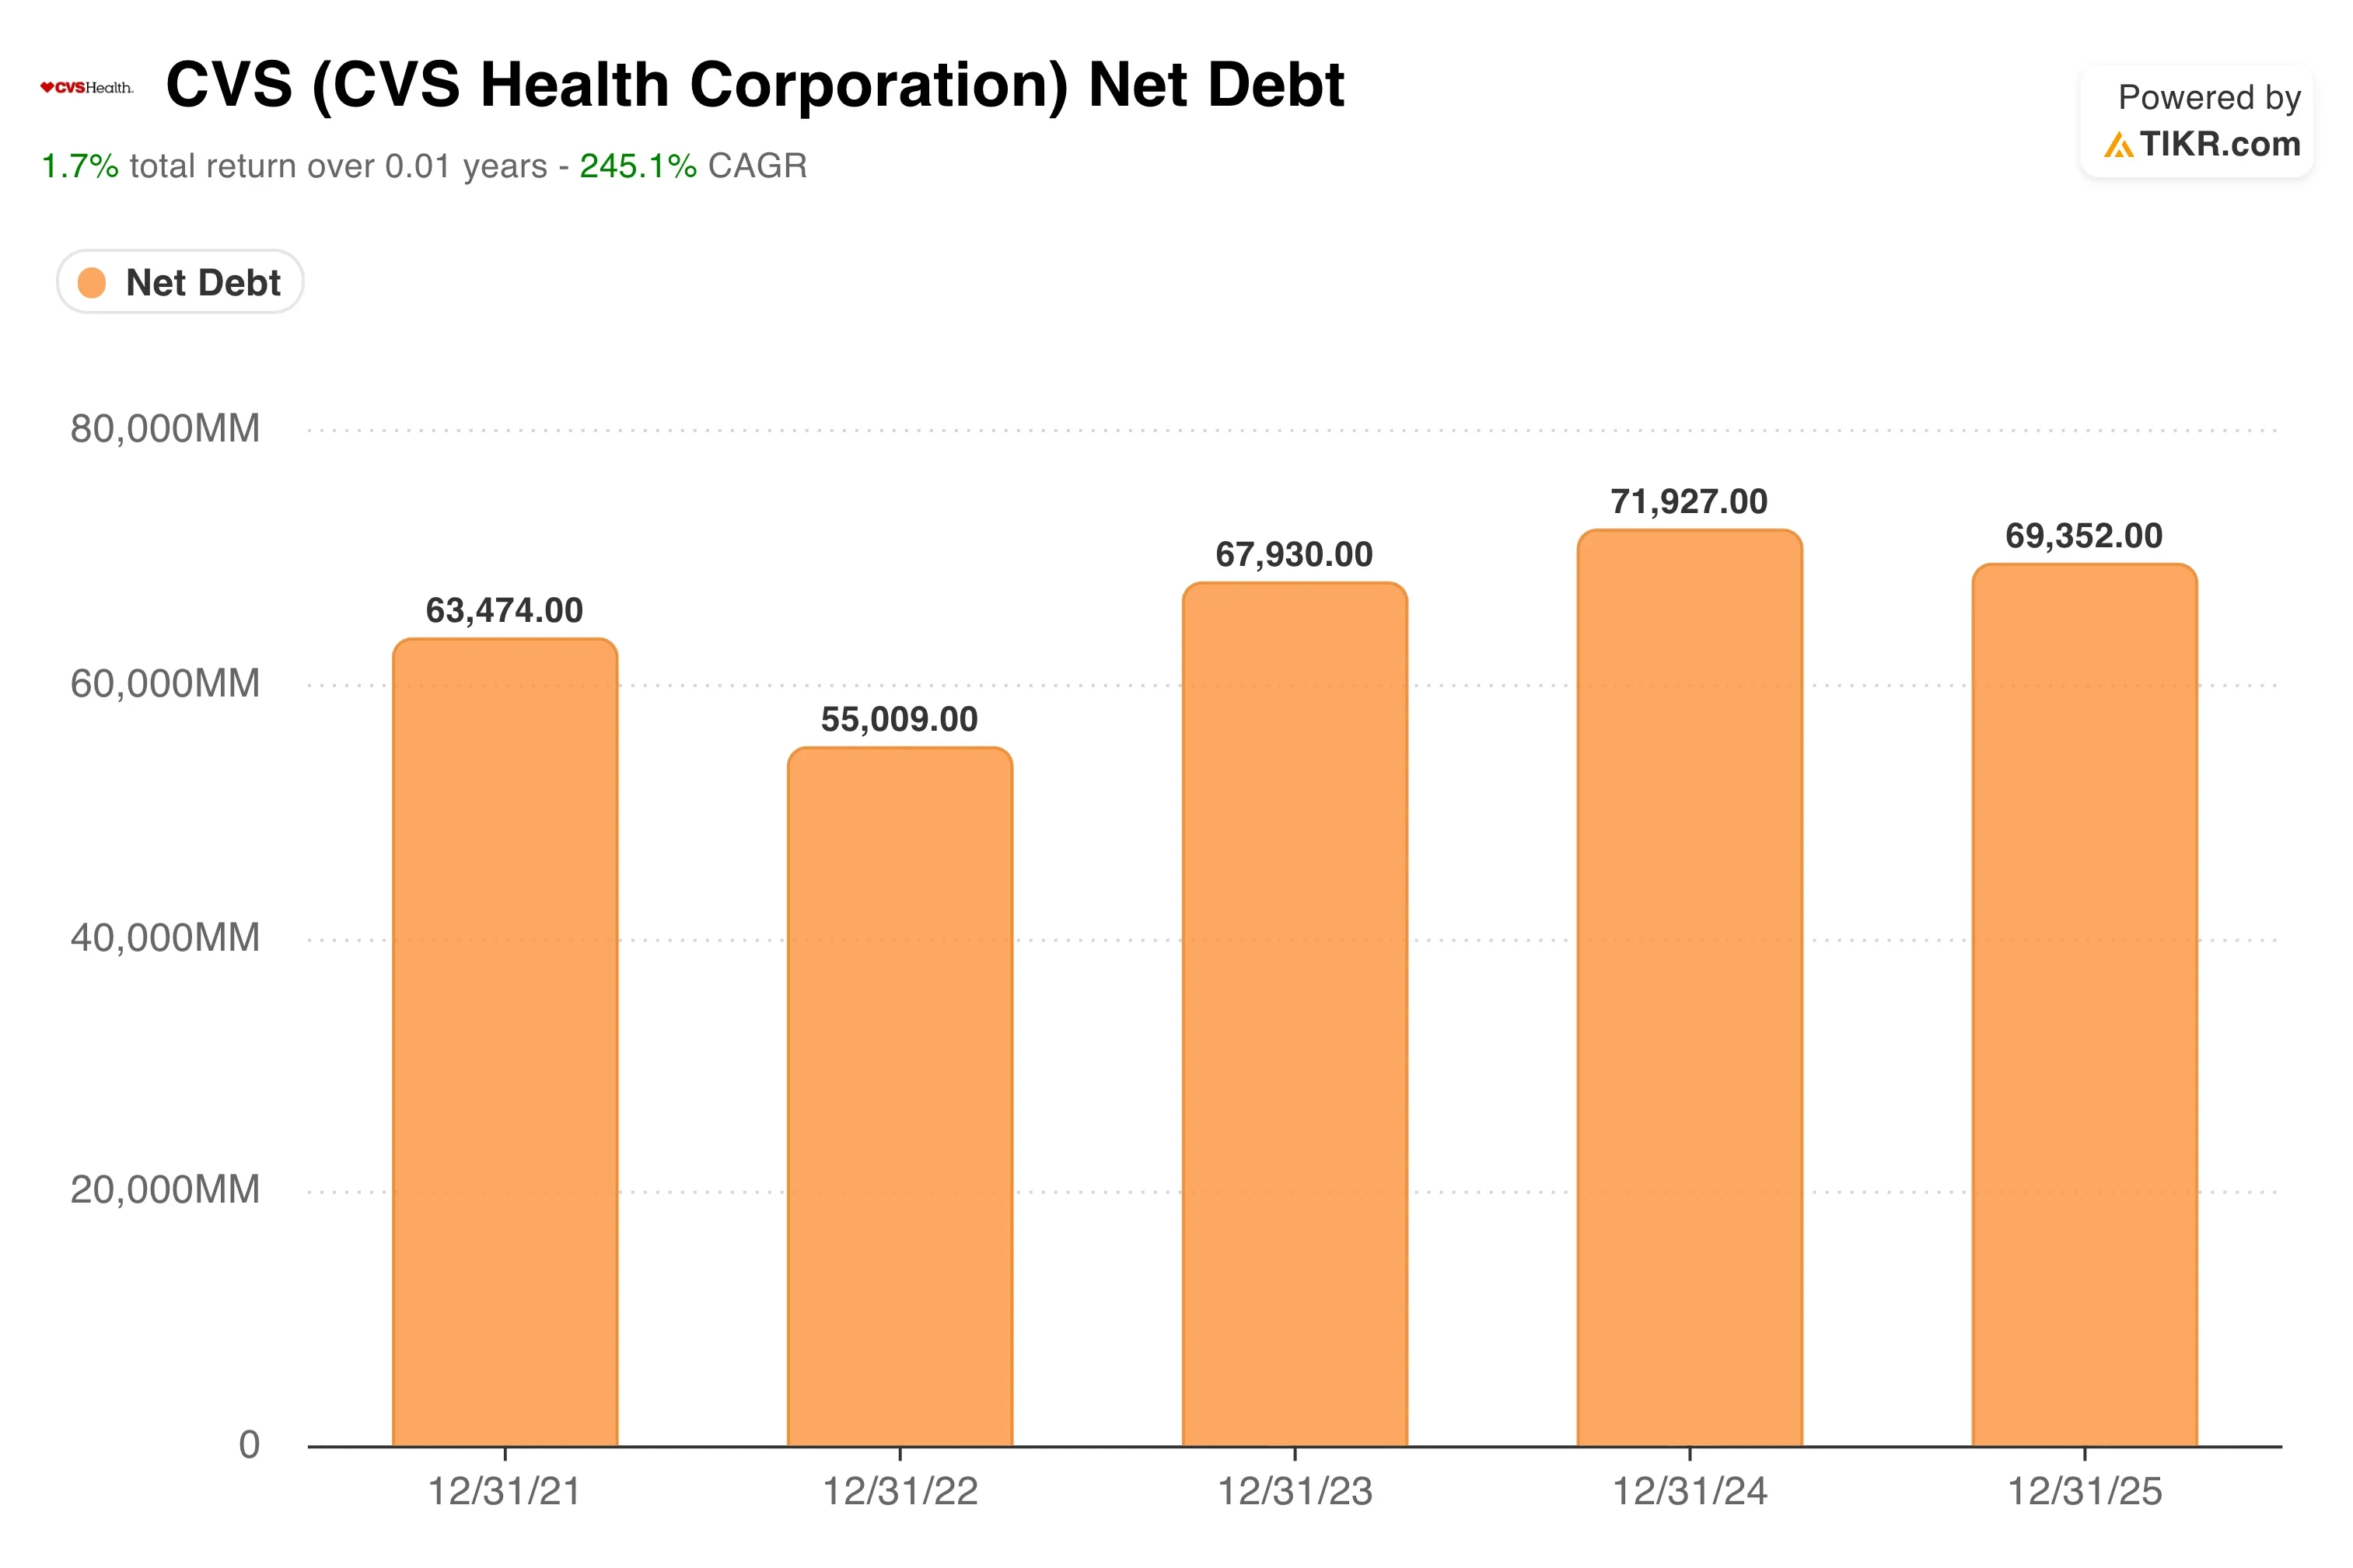 CVS Net Debt (TIKR)
CVS’s LTM net debt is $66.5 billion, which is meaningful. Net debt to EBITDA at 3.61x is elevated but consistent with the company’s history as an investment-grade issuer managing a large PBM and insurance business simultaneously.
The 2.5% dividend yield and 116.1% payout ratio deserve attention. CVS is currently paying more in dividends than it earns under GAAP, reflecting the accounting drag of amortization and restructuring charges. As earnings normalize, the payout ratio should recover to sustainable levels without a dividend cut.
Build a CVS Health earnings recovery model on TIKR and see what the stock is worth under different Aetna margin scenarios (Free) >>>
CVS Against UnitedHealth, Cigna, and the Managed-Care Peer Group
CVS Health competes in three overlapping arenas: pharmacy retail, pharmacy benefits management through Caremark, and managed-care insurance through Aetna. Its closest comparables are UnitedHealth Group (UNH) and Cigna (CI), although CVS’s vertical integration across all three segments is unique.
UnitedHealth is the largest managed-care operator in the U.S. and reported Q1 profit above expectations in April, lifting its 2026 forecast and sending health insurer stocks higher. UNH trades at a significant P/E premium to CVS, reflecting its superior operating margins and more consistent earnings history. Its Optum division, which includes pharmacy benefits and health services, is a direct competitor to CVS Caremark.
The three companies, including Humana and UnitedHealthcare, agreed to adopt a single standard for prior authorization. Prior authorization is the administrative process by which insurers review and approve medical treatments before they occur. That standardization could reduce provider friction and lower Aetna’s administrative costs over time.
Cigna’s Express Scripts is Caremark’s most direct PBM competitor. Express Scripts filed suit to block a pharmacy ownership law in Tennessee, illustrating how intensely the PBM industry is fighting state-level regulatory pressure. CVS faces the same dynamic. Its FTC settlement on insulin pricing, reached in March, resolved one regulatory risk.
 CVS NTM Revenues vs. UNH vs. CI (TIKR)
Broader Congressional scrutiny of PBM practices remains an overhang for the entire sector. CVS’s NTM EV/Revenue of 0.48x and NTM EV/EBITDA of 10.62x are materially cheaper than UnitedHealth’s comparables, reflecting the higher risk embedded in Aetna’s ongoing turnaround but also the meaningful upside if margins recover toward historical norms.
Estimate a company’s fair value instantly (Free with TIKR) >>>
What’s Driving CVS Stock Going Forward?
The Q2 2026 earnings report, expected August 5, is the most important near-term catalyst. Investors will want confirmation that medical cost trends in April and May are consistent with or better than Q1 levels. A second consecutive quarter of controlled medical costs would strongly validate the turnaround thesis and could prompt multiple analysts to raise price targets toward the $142 level implied by the base case model.
The Zepbound formulary reinstatement is a medium-term revenue driver for Caremark. Obesity drugs are the fastest-growing category in pharmacy spending. By adding Zepbound as a preferred option on commercial formularies starting October 1, CVS Caremark positions itself to capture a larger share of GLP-1 drug volume.
GLP-1 refers to glucagon-like peptide-1 receptor agonists, a class of drugs used for diabetes management and weight loss that has driven explosive growth in specialty pharmacy spending. That volume drives dispensing fees, rebate revenue, and member retention for employer plan sponsors.
The AI investment in claims processing is a structural efficiency play. Aetna’s second-generation AI claims platform reduced processing time by over 20%. In a business where administrative expense is a meaningful driver of the medical cost ratio, faster claims processing directly improves profitability.
CVS also expanded its Salesforce Agentforce AI deployment across Aetna and Caremark call centers, reducing per-contact costs at scale. These are not headline catalysts, but they compound into margin improvement over multiple quarters.
The 2027 Medicare Advantage rate environment is the biggest unresolved risk. Medicare Advantage is the private insurance version of Medicare that Aetna offers to seniors. Rates were raised 2.48% for 2027, but CVS management said the final rates remain insufficient to cover medical cost trends.
If that gap persists into 2027 enrollment cycles, Aetna’s managed-care margin recovery will stall. The bear case for CVS is essentially an Aetna bear case. For investors willing to underwrite that risk, however, the 13% annualized return implied by the base case offers a compelling reward for patience.
Track CVS Health’s medical cost ratio trends and Aetna margin history on TIKR >>>
Should You Invest in CVS Health?
The only way to really know is to look at the numbers yourself. TIKR gives you free access to the same institutional-quality financial data that professional analysts use to answer exactly that question.
Pull up CVS, and you’ll see years of historical financials, what Wall Street analysts expect for revenue and earnings in the quarters ahead, how valuation multiples have moved over time, and whether price targets are trending up or down.
You can build a free watchlist to track CVS alongside every other stock on your radar. No credit card required. Just the data you need to decide for yourself.
Analyze CVS stock on TIKR Free→
Looking for New Opportunities?
- See what stocks billionaire investors are buying so you can follow the smart money.
- Analyze stocks in as little as 5 minutes with TIKR’s all-in-one, easy-to-use platform.
- The more rocks you overturn… the more opportunities you’ll uncover. Search 100K+ global stocks, global top investor holdings, and more with TIKR.
Disclaimer:
Please note that the articles on TIKR are not intended to serve as investment or financial advice from TIKR or our content team, nor are they recommendations to buy or sell any stocks. We create our content based on TIKR Terminal’s investment data and analysts’ estimates. Our analysis might not include recent company news or important updates. TIKR has no position in any stocks mentioned. Thank you for reading, and happy investing!


You May Also Like

Tom Lee Stays Bullish Despite Crypto Headwinds

Mexico vs Ecuador Odds: Betting Preview, Prediction Markets and World Cup 2026 Round of 32 Picks