

Silver Price Forecast: Is the 2011 Crash Pattern Repeating?
Key highlights:
- The silver price has rebounded, but traders remain split on whether it's a recovery or a bull trap
- The silver price needs to clear the 100-day SMA near $63.32 to strengthen the recovery
- Fed rate expectations and weak US jobs data are keeping silver volatile
The silver price is currently on an uptrend after bottoming out at around the $56.60 level, although some people do not feel like the pain is over yet. Following a huge drop in price to below $62.70 after being above $121 at its peak, silver has moved up towards $62.70.
Not everyone shares that optimism, though. Some market analysts believe this rebound looks very similar to what happened after silver's historic collapse in 2011, when a powerful recovery rally attracted buyers before another wave of selling pushed prices even lower.
The silver price is testing a very important level
We had a look at the silver daily chart, and one level stands out immediately. The silver price is trading near $62.72, only a fraction below the 100-day simple moving average at $63.32.
That moving average has become the first major technical barrier. Buyers have managed to lift silver from the support zone between $55 and $58, but they have not yet pushed through the descending resistance that has capped every recovery attempt since the May and June highs near $69.
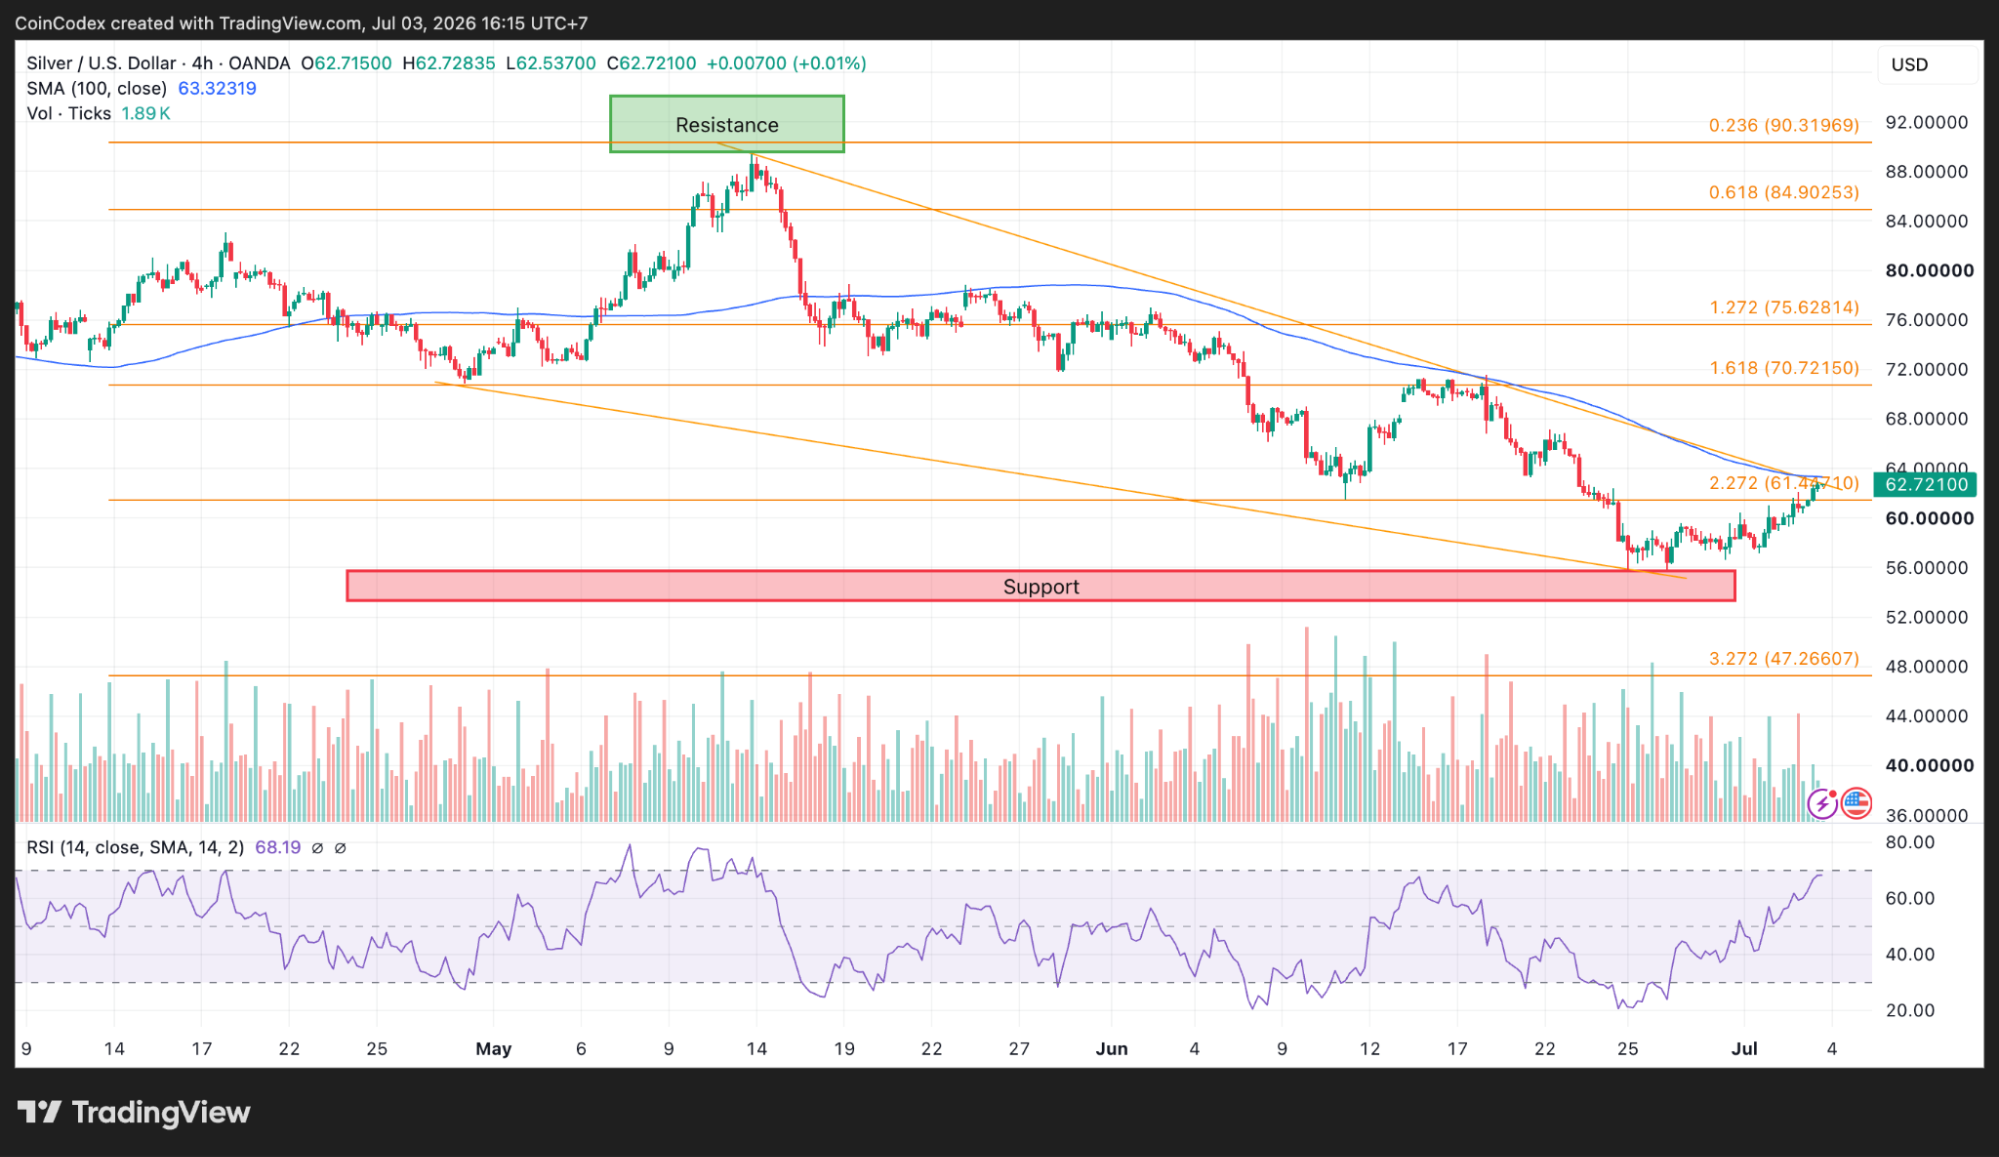
4-hour silver chart analysis
Momentum has improved over the past few sessions. Relative Strength Index is at 68.19, placing it near overbought conditions. This indicates that buyers are dominant in the short term but at the same time gives little scope for any further upside unless there is some more buying pressure on the stock.
The next resistance sits between $63.32 and $65. If buyers clear that area, attention moves back toward $68 and then $70. On the downside, the main support remains between $55 and $58. Losing that zone could expose the next technical objectives near $50 and even $47 using the Fibonacci extension levels shown on the chart.
Why some analysts believe this could be another bull trap for silver
This recent rise has made people think of the silver run-up witnessed back in 2011. Silver back then rose from $18 to $50 and dropped by 64% within just five months. Following this massive drop, there was a rally that led many to believe the bottom had been put in place. Instead, silver rolled over again and continued falling before finally reaching a durable low.
Crypto and commodity analyst Nonzee believes the current structure shares several similarities with that period. His view is that the latest recovery resembles a relief rally that often appears after panic selling. Those rallies tend to attract late buyers before another wave of liquidation clears the market.
His argument is also supported by changes in the silver demand outlook. Industrial demand has been one of the strongest bullish arguments over the past two years, particularly because of solar panel manufacturing. Forecasts for 2026 now point to solar demand declining by about 19%, weakening one of the biggest drivers behind the previous supply shortage narrative.
Another Elliott Wave analysis from More Crypto Online reaches a similar conclusion. The chart labels the recent recovery as a possible B-wave within a larger ABC correction. Under that scenario, one final C-wave decline could still push the silver price back toward the $50-$57 region before a stronger recovery begins.
That outlook only changes if silver breaks above $69.34. Until then, the corrective structure remains valid.
Fed expectations continue to influence the silver price
Technical patterns are only part of the equation. The silver price continues reacting to changes in Federal Reserve expectations. The markets are giving the Fed close to an 80% chance of delivering at least one more interest rate hike this year according to CME FedWatch.
An interest rate rise generally lowers demand for non-interest bearing assets like silver as people earn higher returns through investments in bonds and cash. The latest job numbers from the US labor market made matters complex.
The nonfarm payroll figure for June came at just 57,000, lower than the anticipated figure of 113,000. Moreover, the job numbers were revised downward by 74,000 in total for the previous two months, bringing the three-month average of payroll gains down to 111,000 from 164,000.
This decline aided silver's recovery, considering the statement made by Federal Reserve Board member Kevin Warsh about easing inflation concerns and forward guidance possibly being out-of-date.
The markets will now shift focus on the latest JOLTS release where economists project a decrease in job openings from 7.618 million to 7.3 million. In addition, a soft jobs number would dampen expectations of further monetary tightening, providing an impetus to precious metals.
In other parts of the world, geopolitics have somewhat improved. The United States and Iran have reinitiated their indirect talks about navigation in the Strait of Hormuz, which led to Brent dropping to its four-month low since the increase in Iranian oil exports after the peace deal signed in June.
Can the silver price keep recovering?
The silver price has improved noticeably since bouncing from the $56 region, but one important hurdle remains. It is now incumbent upon the buyers to retake the 100-day moving average at around $63.32.
Any closing above this would improve the technical position and make a run towards $65 possible, followed by $68 and $70. A failure here will keep the overall correction intact. However, in case the sellers return and silver declines to the area below $55-$58, the technical picture still allows for a run towards $50.
That possibility explains why opinions remain divided. Short-term momentum has improved, but the bigger trend has not yet changed. For now, the next move around $63 may decide whether this recovery develops into something much larger or turns into another trap similar to the one silver investors experienced more than a decade ago.
According to CoinCodex's 1-month silver price forecast, the silver price could trade around $57.17 over the next month, indicating the market may retest key support if buyers fail to push above the $63.32 resistance level.


You May Also Like

AI predicts XRP price for April 30, 2026

Cryptopolitan Launches Crypto Data Dashboards and Becomes the First Media Platform with Full Agentic AI Access


