

Solana (SOL) Price at Critical Juncture: Will $70 Support Hold or Break?
Key Takeaways
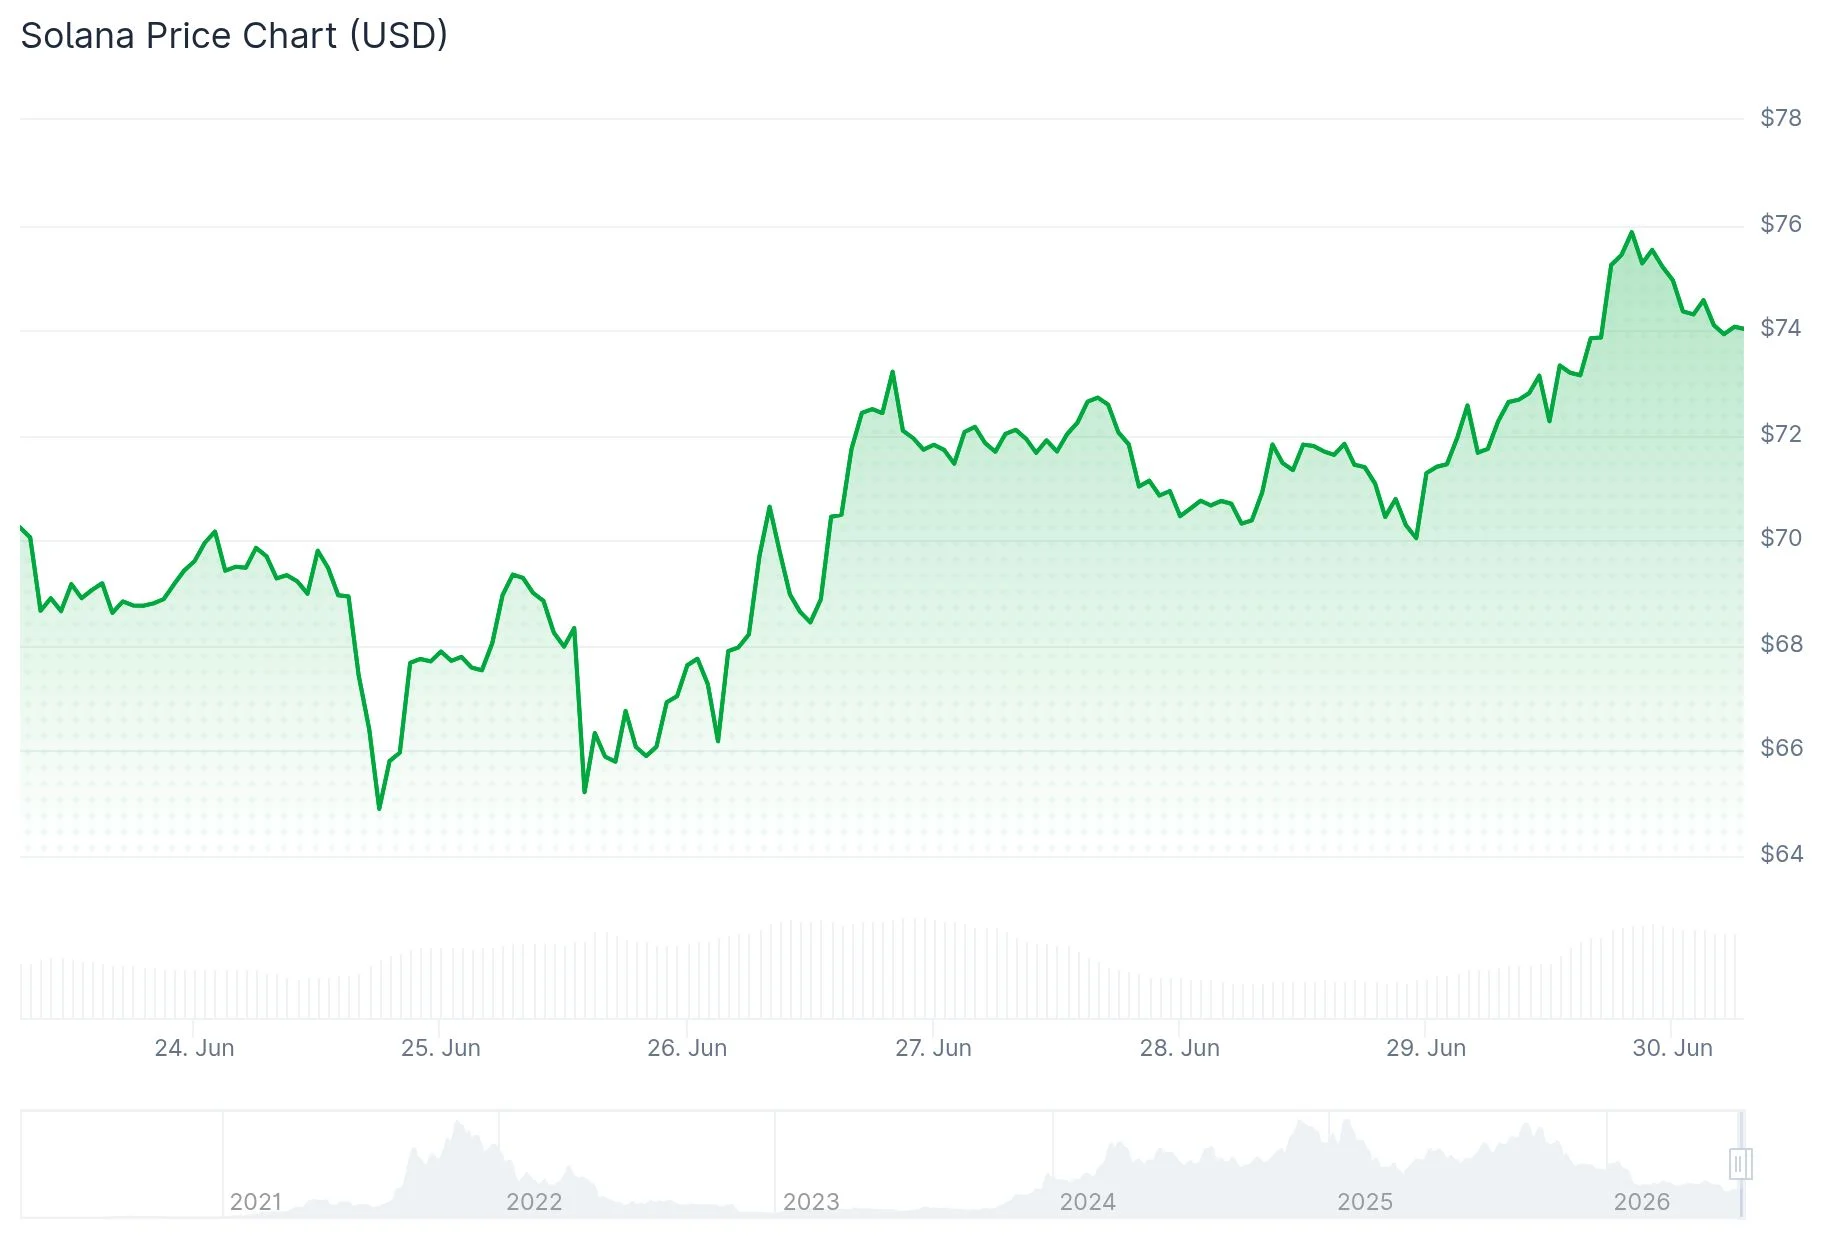
- Solana is currently testing a critical demand zone between $65 and $71 after retreating to $71.37.
- Over 60 million SOL tokens were transacted within the $65–$71 range, establishing it as a significant support area.
- Failure to maintain $70 could trigger declines toward $64, followed by $53.10, based on URPD analysis.
- Technical indicators show RSI at 51.60 with a bullish MACD crossover, hinting at potential momentum shifts.
- World Xyz, a Solana-based project, officially launched, injecting renewed enthusiasm into the community.
Solana’s price has retreated to $71.37 in the last 24 hours. This decline mirrors Bitcoin’s broader market correction that affected most cryptocurrencies.
 Solana (SOL) Price
Blockchain data reveals that over 60 million SOL tokens were traded between the $65 and $71 price levels. This concentration of activity establishes this range as a formidable nearby support area.
When significant supply clusters form within a specific price band, they typically function as a buffer during market downturns. Numerous investors established their positions within this zone and may actively defend these levels.
Should SOL maintain support above $70, the asset could enter a consolidation phase. Subsequently, it might challenge the resistance barrier near $73.
A breach below $70 would alter the technical outlook significantly. Market participants would then monitor for potential movement toward the $64 level, according to recent technical assessments.
Critical Support Zones Under Watch
Should the $64 level give way, additional support areas exist at $53.10, $23.60, and $8.85. The $53.10 zone carries particular significance for near-term price action, with approximately 7 million SOL having changed hands at that level.
The present downturn isn’t driven by Solana-specific factors. Bitcoin declined 1.43% during the same timeframe, while overall cryptocurrency market capitalization contracted 1.18%.
This correlation demonstrates that Solana continues exhibiting high-beta characteristics. When Bitcoin experiences selling pressure, alternative cryptocurrencies typically amplify those movements.
The Fear and Greed Index currently registers 16, reflecting prevailing market caution. SOL is positioned beneath its 30-day EMA around $72.48.
The daily RSI indicator hovers near 34.83, indicating subdued momentum. While MACD remains in negative territory, the histogram displays marginal improvement.
Alternative technical analysis presents a more optimistic scenario. RSI has advanced to 51.60, with the signal line at 45.95, while the MACD line exhibits a bullish crossover with a histogram reading of 0.68730.
These technical signals indicate potential easing of downward pressure. Validation would require increased trading activity and decisive closes above resistance thresholds.
Project Developments and Market Commentary
The enigmatic Solana initiative World Xyz has officially unveiled itself following extended speculation. The project previously acquired the world.xyz domain for $80,000.
Vibhu from the Solana Foundation characterized World as an agentic, intent-focused settlement infrastructure constructed on the x402 protocol. The platform functions as a decentralized framework for tokenizing tangible assets.
Following this revelation, SOL’s price appreciated 2.86% over 24 hours. Market analyst 0xNeena indicated that losing the $65–$75 support corridor would leave SOL vulnerable to further declines toward the $50–$55 range.
On X, analyst Sjuul from AltCryptoGems observed that SOL “has been showing some strength on lower time frames” while noting that “on higher time frames it is still in trouble.” Sjuul emphasized that meaningful recovery requires SOL to recapture the $78 threshold.
Solana’s trading volume allegedly surged over 3,200% during Q2, hitting $67 billion. Memecoin trading, staking protocols, and diverse applications contributed to this substantial growth.
Solana ETF flow data indicated $5.8 million in net outflows throughout June. A $15 million short position has sparked discussion regarding whether the current correction might intensify.
CryptoPatel identified an extended support corridor between $40 and $60, projecting ambitious long-term targets at $500 and $1,000 should SOL reclaim higher resistance zones eventually. Analyst Ardi suggested one final capitulation below present levels remains plausible before any substantial recovery materializes.
The post Solana (SOL) Price at Critical Juncture: Will $70 Support Hold or Break? appeared first on Blockonomi.


You May Also Like

Metaplanet Now Holds 40,177 BTC – Here’s What They Paid for It

Bitcoin treasury sell-off accelerates as Riot, Bhutan, and public companies exit positions


