

Snap’s Free Cash Flow Hit $437 Million in 2025, but the Market Still Isn’t Buying the Turnaround
Key Stats for Snap Inc. Stock
- 52-Week Range: $3.81 – $10.41
- Current Price: $5.65
- Street Mean Target: $7.63
- Street High Target: $110.00
- TIKR Annualized IRR (Mid): ~13% / year
Snap (SNAP) has spent years trying to convince the market that it is more than a niche social platform with a monetization problem. Q1 2026 made a reasonable case, revenue up 12% to $1.53 billion, adjusted EBITDA of $233 million versus $108 million a year ago, and free cash flow of $286 million in a single quarter.
The market’s response has been to send the stock down more than 35% year to date. The disconnect says a lot about where Snap stands: the underlying numbers are improving, but every step forward seems to come with a new reason to hesitate.
Value your favorite stocks like SNAP with 5 years of analysts’ forecasts using TIKR’s new Valuation Model (It’s free) >>>
The Financial Progress Is Clearer Than the Stock Price Suggests
The clearest sign of operational improvement is what happened to free cash flow. Snap generated $437 million in full-year 2025, up sharply from $35 million in 2023 and $219 million in 2024.
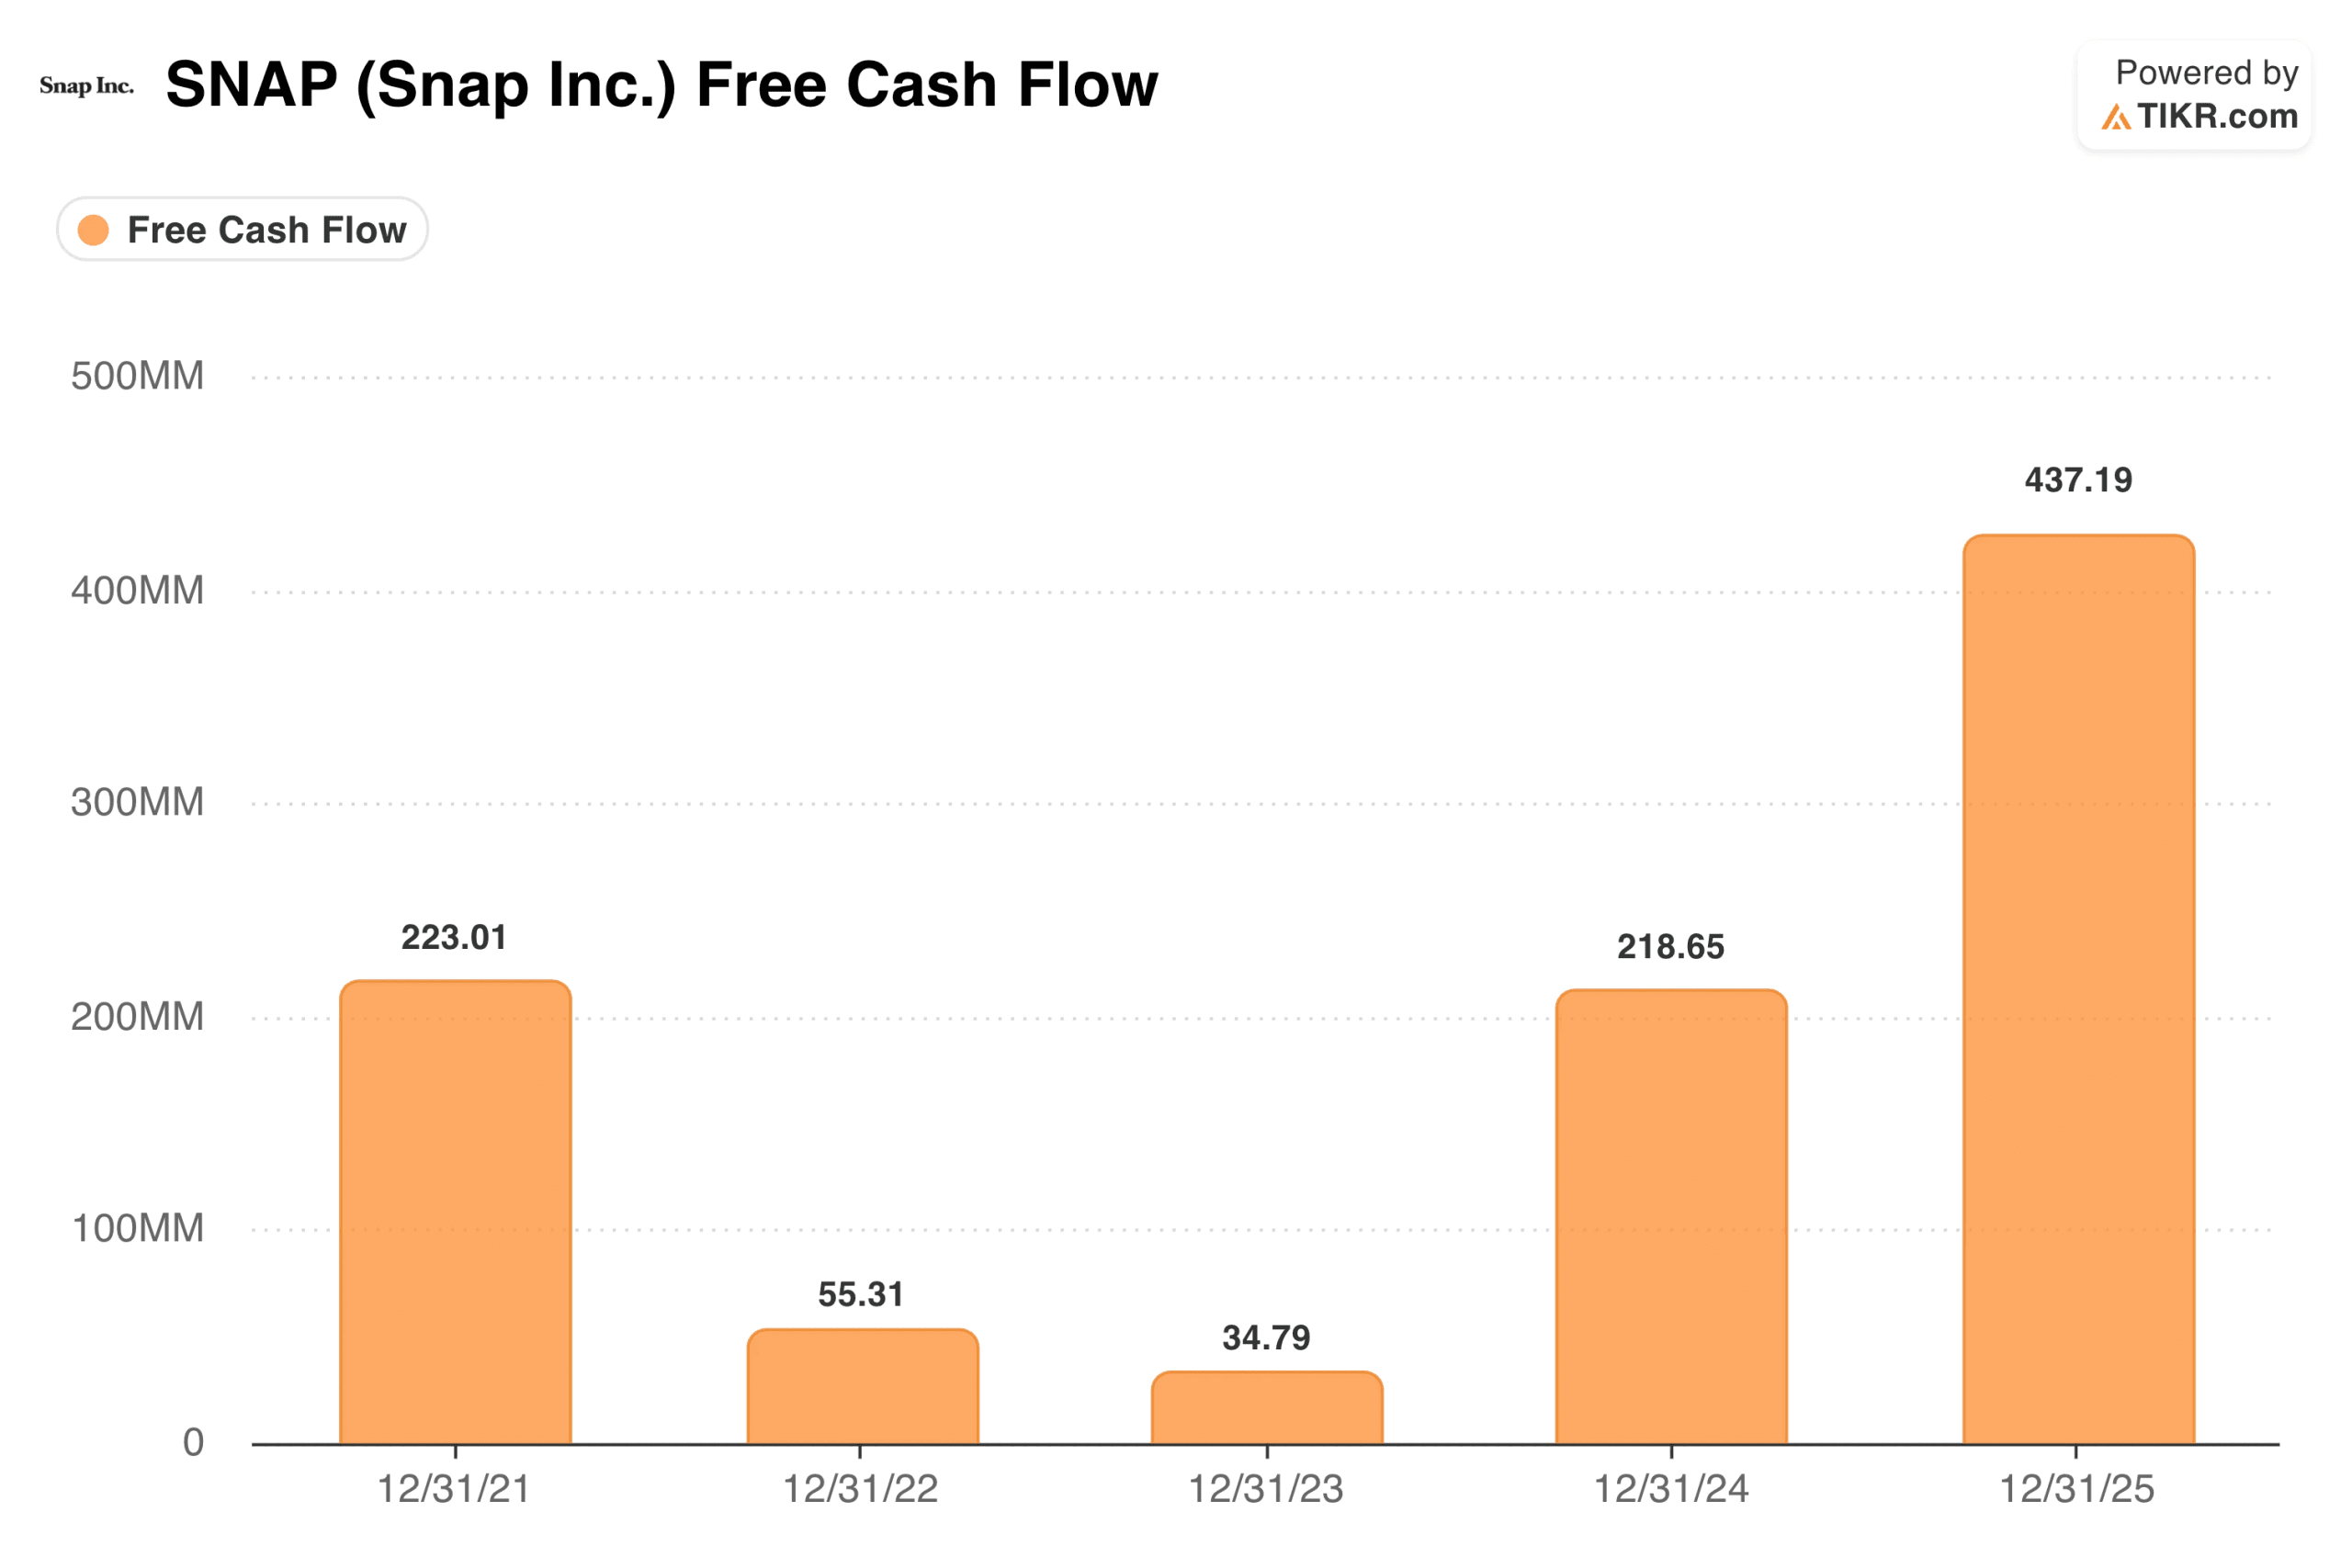 Snapchat Free Cash Flow. (TIKR)
Gross margin expanded to 57% in Q1, up three percentage points year over year, and adjusted EBITDA margin reached 15% compared to 8% a year ago.
Snap ended the first quarter with $2.8 billion in cash, providing a stable balance sheet as the business works through its transition.
The Ad Business: Real Progress, Real Headwinds
Snap’s core revenue engine is digital advertising, and Q1 was genuinely mixed. Newer ad formats showed traction, Dynamic Product Ads grew more than 30% year over year, and Sponsored Snaps drove a 226% improvement in click-through rates.
But large North American advertisers pulled back, geopolitical uncertainty cost an estimated $20 to $25 million in March alone, and a high-profile AI content deal with Perplexity collapsed, removing a revenue contribution analysts had been counting on. JPMorgan cut its price target to $6 with an underweight rating, citing weak Q2 guidance as the primary concern.
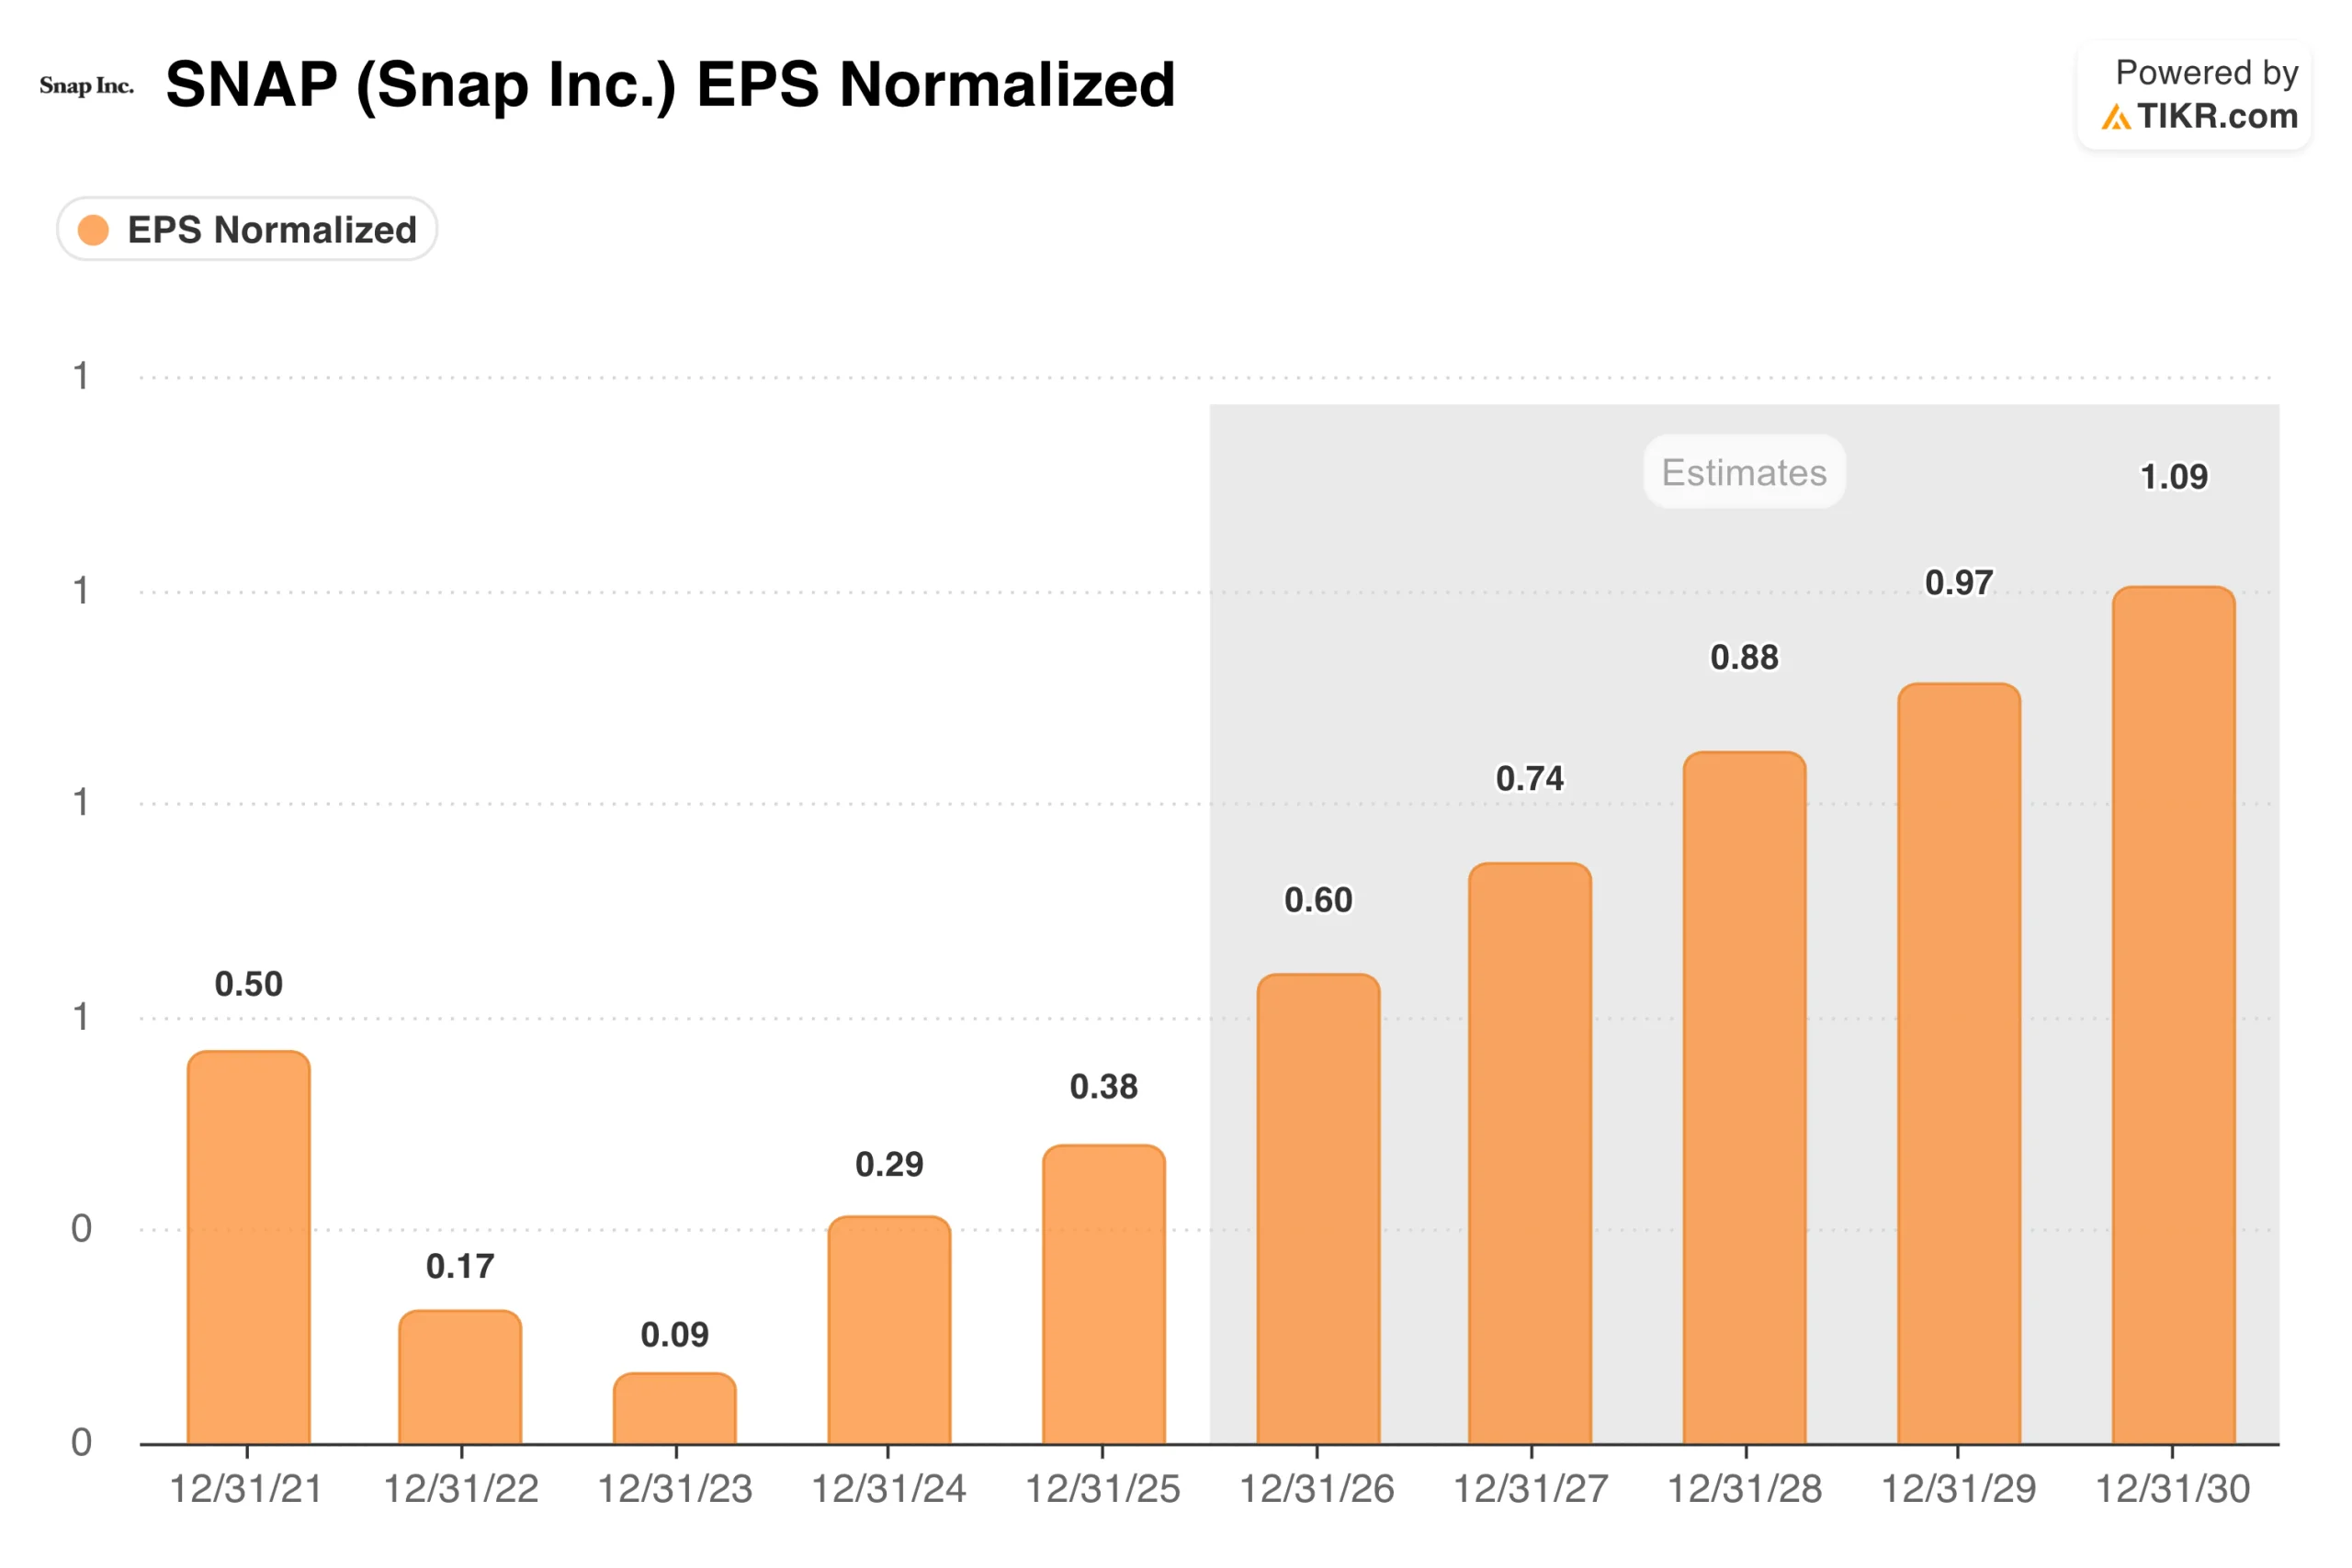 Snapchat EPS Normalized. (TIKR)
Normalized EPS bottomed near zero in 2023 and has been slowly rebuilding, with consensus projecting around $0.60 in 2026 and a path toward $1.09 by 2030. The direction is right, but the pace requires patience, the market hasn’t been willing to supply.
Snap+ subscription revenue grew 87% year over year to $285 million in Q1, which is an encouraging sign that the company is reducing its dependence on advertising alone.
See historical and forward estimates for Snap stock (It’s free!) >>>
Spectacles and the AR Bet
Advertising alone probably can’t get Snap back to where investors once valued it, which is why the company has been building a second act around augmented reality.
Snap recently acquired Illumix to accelerate its next-generation Spectacles smart glasses, built in partnership with Qualcomm. The Snap Map reached 450 million monthly active users in Q1, and AR Lenses were used more than 9 billion times per day on average.
Whether any of this becomes a meaningful revenue stream remains an open question, but the subscription momentum suggests Snap is making progress diversifying beyond ads.
What the Valuation Model Says About the Risk-Reward
At around $5.65, Snap trades at roughly 7.5 times forward EBITDA with 483 million daily active users and improving profitability.
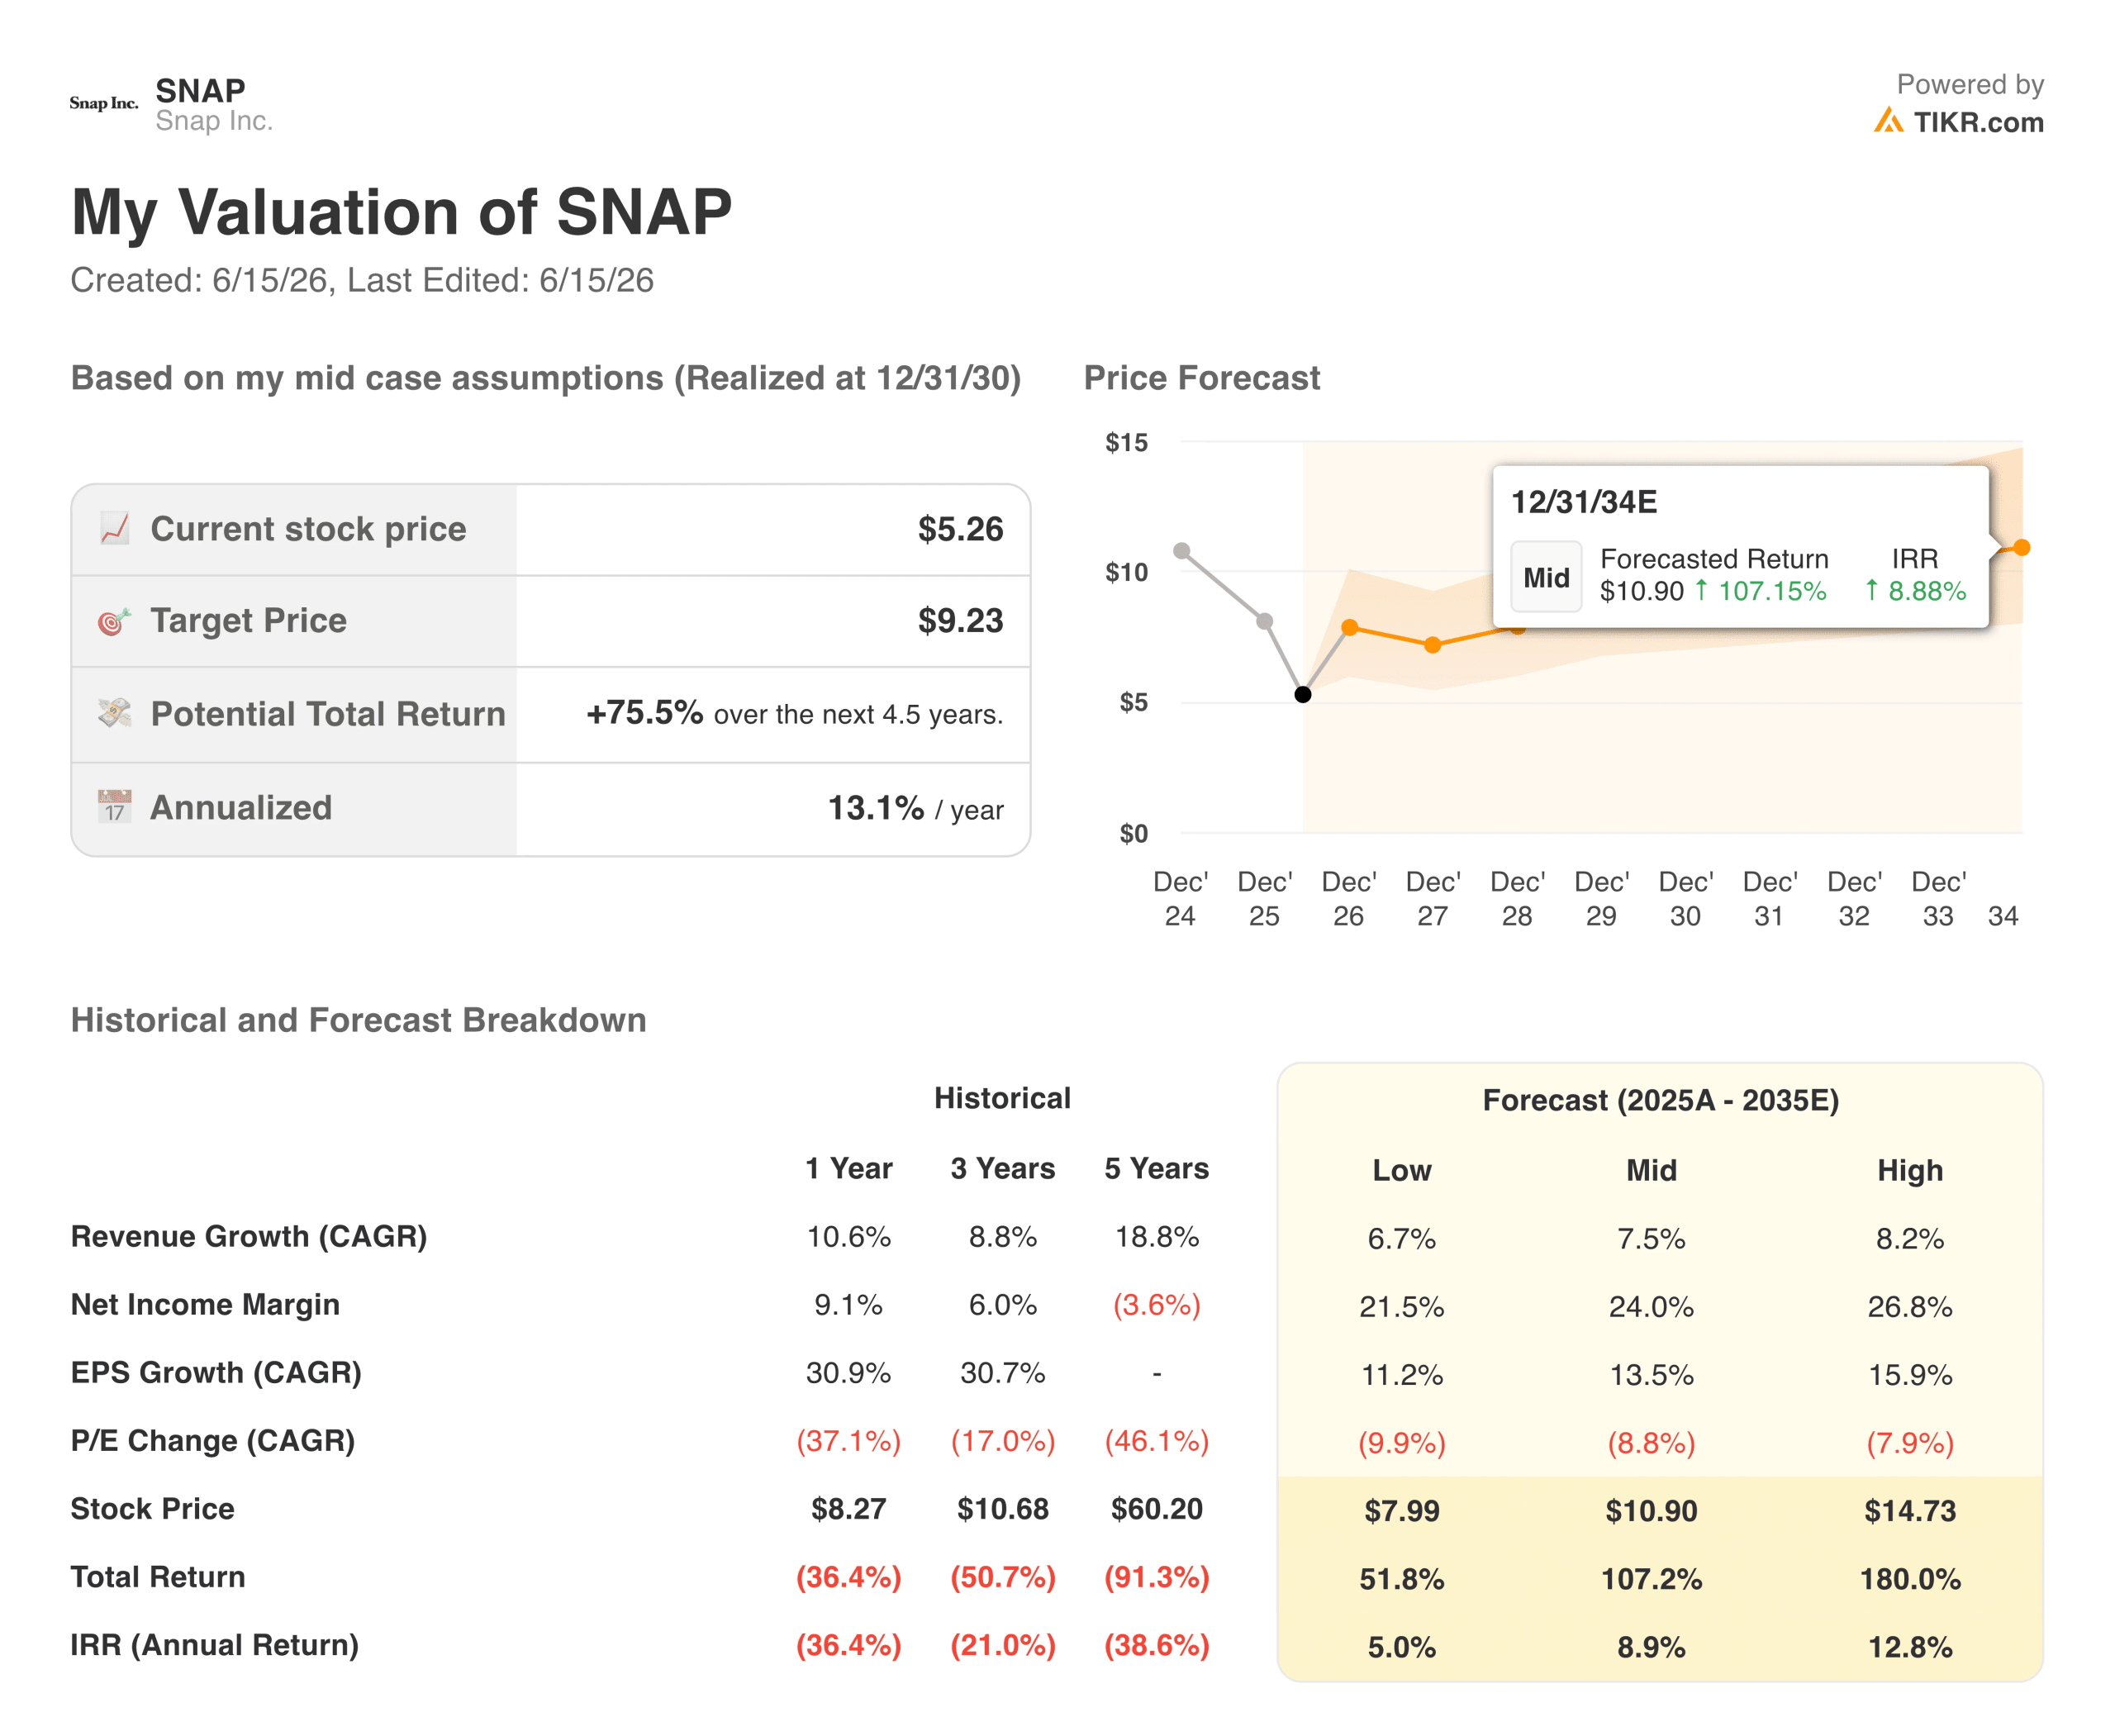 Snapchat Valuation Model. (TIKR)
TIKR’s model targets around $9 per share in the mid case, representing about 75% total return at roughly 13% annualized over the next 4.5 years. The low case arrives near $8 at about 5% annually; the high case projects toward $15 at close to 13% per year.
Returns across all scenarios are driven by earnings growth rather than multiple expansion, with the model assuming meaningful P/E compression along the way.
Revenue growth of around 7% to 8% annually through 2035 is the key assumption, with net income margins expanding from around 9% toward 24% as cost discipline holds and newer revenue streams scale.
Estimate a company’s fair value instantly (Free with TIKR) >>>
Should You Invest in Snap, Inc?
Snap’s financial turnaround is progressing, free cash flow is up sharply, margins are expanding, and the user base is growing. The stock is also down more than 45% from its 52-week high, which suggests a meaningful amount of bad news is already priced in.
The harder question is timing. The ad business faces near-term headwinds that won’t resolve quickly, and the AR bet is years away from contributing at scale.
For patient investors willing to look past a difficult 2026, the setup is more interesting than the stock price implies. For those who need the numbers to improve first, there may be time to wait.
Analyze Tenable Holdings stock on TIKR Free→
Looking for New Opportunities?
- See what stocks billionaire investors are buying so you can follow the smart money.
- Analyze stocks in as little as 5 minutes with TIKR’s all-in-one, easy-to-use platform.
- The more rocks you overturn… the more opportunities you’ll uncover. Search 100K+ global stocks, global top investor holdings, and more with TIKR.
Disclaimer:
Please note that the articles on TIKR are not intended to serve as investment or financial advice from TIKR or our content team, nor are they recommendations to buy or sell any stocks. We create our content based on TIKR Terminal’s investment data and analysts’ estimates. Our analysis might not include recent company news or important updates. TIKR has no position in any stocks mentioned. Thank you for reading, and happy investing!


You May Also Like

BitGo Launches Stablecoin Minting and Redemption Service for Institutions
Hedera Price Prediction Holds Bullish as Iran Peace Deal Pushes Bitcoin Above $65,000 and Pepeto Presale Passes $10 Million
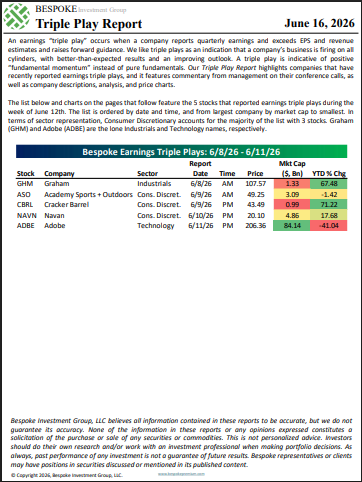
The Triple Play Report: 6/16/26


