

Crypto Price Prediction for Today, June 5: Solana (SOL), XRP, and Bitcoin (BTC)
Three of the most-watched crypto assets are bleeding. Solana, XRP, and Bitcoin have all spent the past several days posting red candles, and today’s early price action does not look any different.
Something is clearly weighing on the broader market, and the numbers tell a consistent story across all 3 tokens.
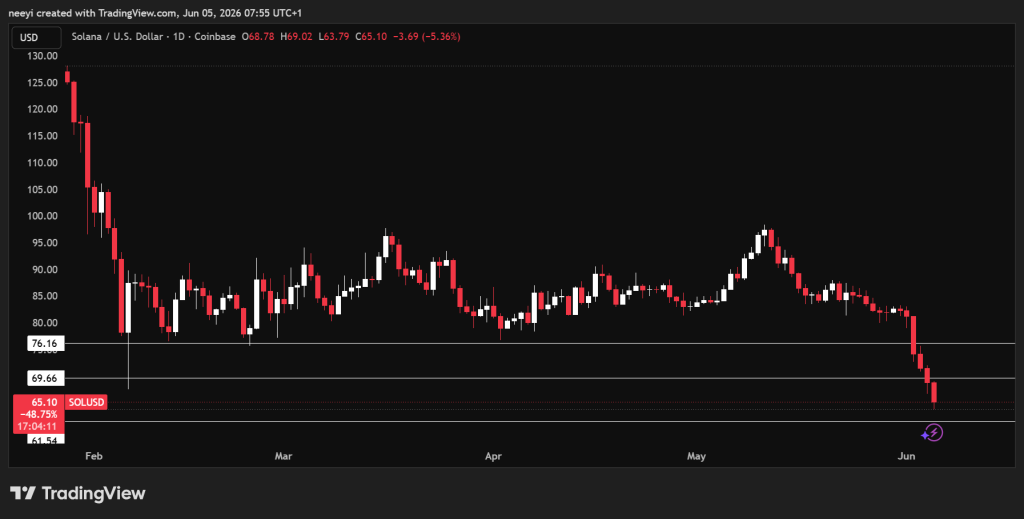
Solana Has Broken Below $69 and Keeps Falling
The SOL price has now posted red candles for almost a week straight. Solana currently trades around $65, and the $69 level that once acted as support has since been broken and retested. The retest failed, which typically signals that sellers are firmly in control. The key price levels to watch today are $76, $66, and $61.
A look at the RSI reading of 15.142 shows that Solana is sitting in deeply oversold territory. Readings this low are rare and indicate the asset has been sold heavily over a short period. That alone doesn’t guarantee a reversal, but it does show how aggressive the selling has been.
 SOL Price Chart / TradingView.com
The Stochastic oscillator reads 32.877, which is a sell signal. This confirms that short-term momentum is still pointed downward, and buyers have not stepped in with any conviction yet.
The MACD reading comes in at -3.702, another sell signal. A negative MACD like this reflects a bearish crossover between the signal line and the MACD line, meaning downward momentum remains the dominant force on the Solana chart.
The Ultimate Oscillator reads 40.143, also a sell signal. This indicator combines short, medium, and long-term price momentum into one reading. A result below 50 leans bearish, and 40 confirms that pressure across multiple timeframes is still to the downside.
| Name of Indicator | Metric | Interpretation of Readings |
|---|---|---|
| RSI (14) | 15.142 | Extremely oversold; heavy selling pressure over recent sessions |
| STOCH (9,6) | 32.877 | Sell signal; short-term momentum remains bearish |
| MACD (12,26) | -3.702 | Sell signal; bearish crossover confirms downward momentum |
| Ultimate Oscillator | 40.143 | Sell signal; bearish pressure across multiple timeframes |
Solana (SOL) Price Prediction for Today, June 5
The bearish scenario keeps $61 in play as the next downside target. A brief retracement toward $69 is possible, but that level now acts as resistance rather than support. The outlook remains bearish as long as the SOL price stays below $69.
The neutral scenario depends on whether Solana can break back above $69 and hold it on a retest. A successful retest could push the price into the $70s zone, with $76 acting as the upper boundary of that range.
The bullish scenario is the least likely outcome today. It would require a clean break above $76 and a return into the consolidation range that held for nearly 4 months earlier this year.
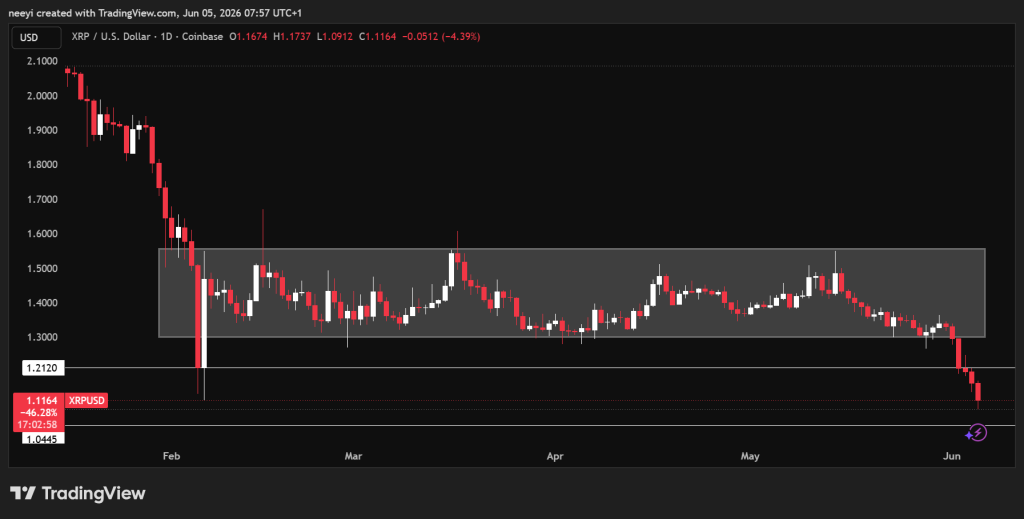
XRP Price Nears $1.0 After Five Straight Days of Losses
XRP has posted 5 consecutive red days, and today looks on course to make it 6. The token currently trades around $1.11, and the bearish momentum could push the XRP price down to $1.0 if selling continues at this pace. The key levels to monitor are $1.21 and $1.3, both of which would need to be reclaimed for any meaningful recovery.
 XRP Price Chart / TradingView.com
The RSI reading of 16.933 places XRP in deeply oversold territory. The reading is nearly as extreme as Solana’s, which confirms that the selling across both assets has been heavy and sustained over the past week.
The Stochastic oscillator reads 36.111, a sell signal. Short-term momentum is still pointing lower, and there is no indication yet that buyers are stepping in to absorb the pressure.
The MACD reading sits at -0.044, another sell signal. The value is very close to zero, which means bearish momentum is present but has not fully accelerated. That could change quickly if the $1.0 level fails to hold.
The Ultimate Oscillator reads 37.279, also a sell signal. The reading falls below the 50 midpoint, confirming that bearish pressure is visible across short, medium, and long-term momentum windows.
| Name of Indicator | Metric | Interpretation of Readings |
|---|---|---|
| RSI (14) | 16.933 | Deeply oversold; sustained selling pressure across recent sessions |
| STOCH (9,6) | 36.111 | Sell signal; short-term momentum still bearish |
| MACD (12,26) | -0.044 | Sell signal; bearish momentum present, near zero crossover point |
| Ultimate Oscillator | 37.279 | Sell signal; below midpoint across multiple momentum timeframes |
XRP Price Prediction for Today, June 5
The bearish outlook targets $1.0 as the next key level. The range between $1.0 and $1.21 keeps XRP in bearish territory, and today’s price action shows no sign of a change in that direction.
The neutral scenario opens up if XRP can break above $1.21 and hold. That could set up a consolidation phase between $1.21 and $1.3 as the market searches for its next move.
The bullish scenario requires a clean break back above $1.3. A return to that level would change the short-term XRP price outlook and could give the token room to push higher over the following days.
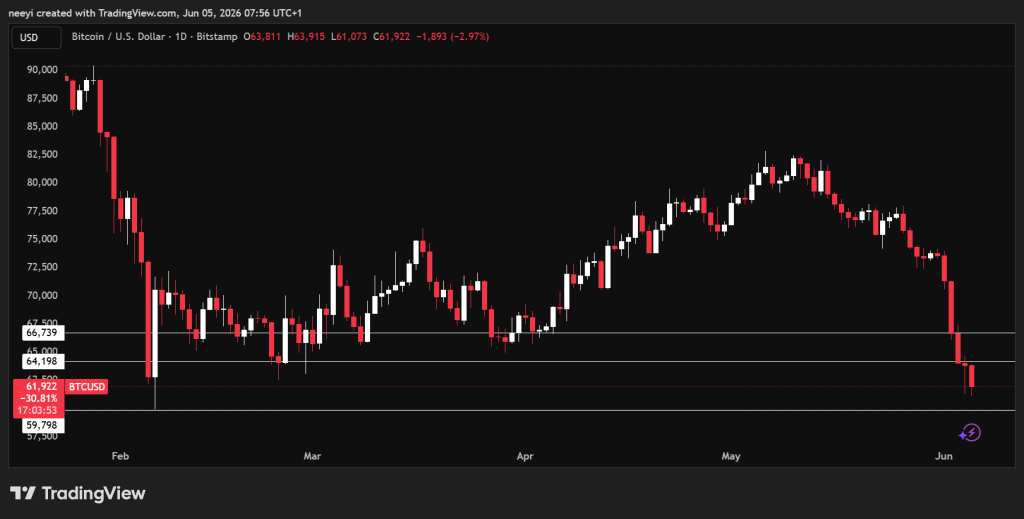
Bitcoin Leads the Decline With 5 Red Candles and a $59,800 Target in View
Bitcoin sets the tone for the broader market, and right now that tone is bearish. BTC currently trades around $61,500 after 5 straight days of losses. The next downside target sits at $59,800, a level that would draw significant attention if reached. Other key levels on the chart include $64,200 and $66,800 to the upside.
 BTC Price Chart / TradingView.com
The RSI reading of 14.136 is the most extreme of the 3 assets covered today. Bitcoin is deeply oversold, and a reading this low reflects relentless selling pressure over multiple sessions without any meaningful relief bounce.
The Stochastic oscillator reads 91.777, which registers as overbought. This creates an interesting divergence: the RSI is deeply oversold while the Stochastic is overbought. That kind of conflict between indicators can sometimes precede a short-term bounce, though it does not override the broader bearish trend on the Bitcoin chart.
The MACD reading comes in at -2624.8, a strong sell signal. This is a substantial negative reading and reflects deep bearish momentum. The gap between the MACD line and the signal line has widened considerably, which confirms that sellers have been dominant for several consecutive sessions.
The Ultimate Oscillator reads 41.876, also a sell signal. Much like what we see across Solana and XRP, the reading falls below the 50 midpoint, confirming bearish pressure across multiple timeframes.
| Name of Indicator | Metric | Interpretation of Readings |
|---|---|---|
| RSI (14) | 14.136 | Most oversold of the 3 assets; intense and sustained selling pressure |
| STOCH (9,6) | 91.777 | Overbought; divergence with RSI may hint at short-term relief |
| MACD (12,26) | -2624.8 | Strong sell signal; wide bearish gap between MACD and signal line |
| Ultimate Oscillator | 41.876 | Sell signal; bearish momentum confirmed across multiple timeframes |
Bitcoin (BTC) Price Prediction for Today, June 5
The bearish scenario puts $59,800 as the immediate downside target. A deeper move toward $59,000 is also possible if sellers maintain control throughout the session.
The neutral scenario depends on whether Bitcoin can reclaim $64,200. A move back above that level would ease some of the downward pressure and could open a path toward $66,800.
The bullish scenario requires BTC to break cleanly above $66,800. That would change the short-term narrative in a meaningful way, but it remains the least likely outcome based on today’s setup.
FAQs
Subscribe to our YouTube channel for daily crypto updates, market insights, and expert analysis.
The post Crypto Price Prediction for Today, June 5: Solana (SOL), XRP, and Bitcoin (BTC) appeared first on CaptainAltcoin.


You May Also Like

The Evolution of Specialised Lending: Navigating Complexity and AI Integration with Loan IQ

Oil: Elevated Prices Sustain Inflation Spillovers, Commerzbank Warns

Coinbase CEO Armstrong Fires Back at Dimon Over CLARITY Act


